Real-Time Tomcat Log Analysis
-
Aggregate and analyze all your logs
Consolidate all your logs into a single location to analyze all of your services and apps together. -
Diagnose issues in real-time
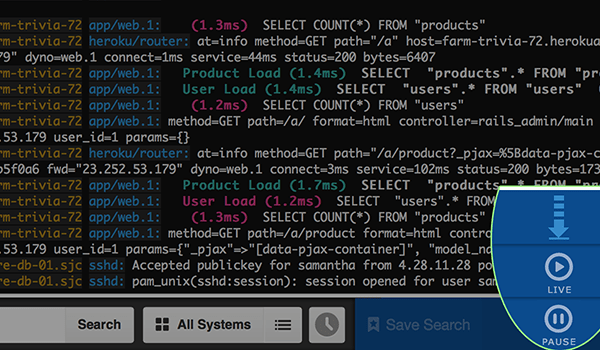
View log messages in real time with live tail and catch errors as they happen. Seamlessly navigate through your logs with clickable elements. -
Monitor your services with alerts
Proactively monitor your Tomcat web servers and spot issues before they affect your users with alerts and notifications.

Here's How Papertrail Helps

Aggregate and analyze all your logs
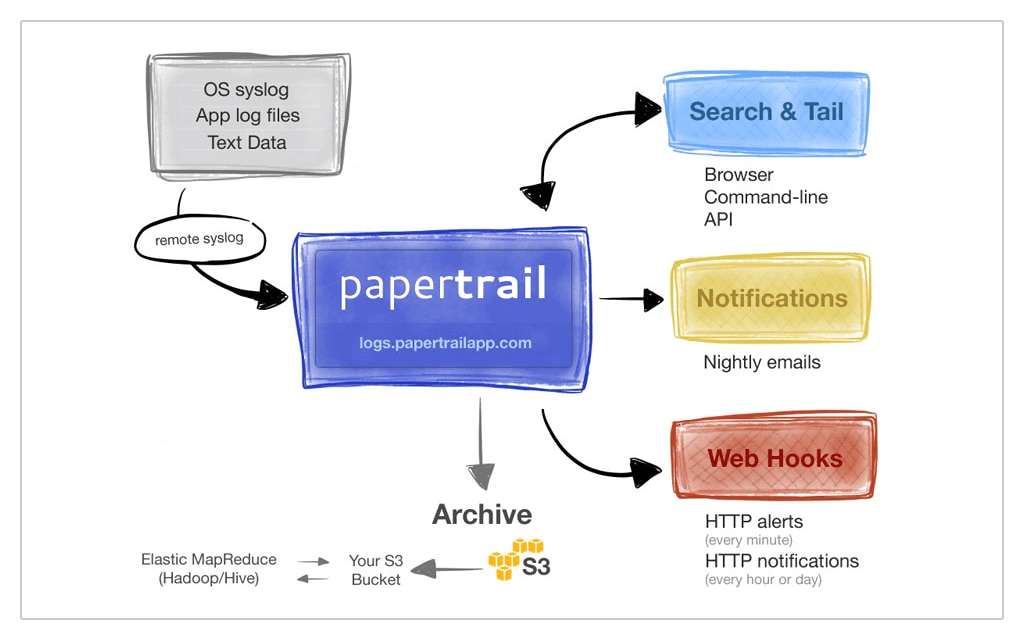
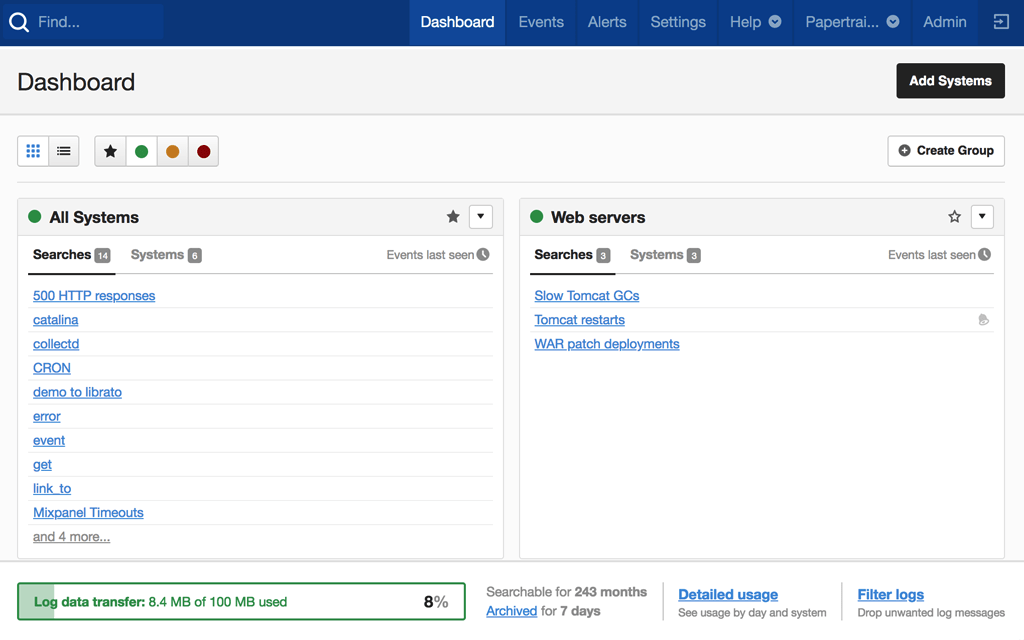
Consolidate all of your Apache Tomcat logs into a single location to build an infrastructure-wide history of your web servers. Easily search through all of your logs together with the intuitive event viewer interface from SolarWinds® Papertrail™, and find the log messages you need when troubleshooting using the simple search syntax. All of your Tomcat logs are stored in the cloud using an Amazon S3 bucket, so no matter how much data you need, there’s always room to expand your storage capacity to keep up with your logging requirements. This makes it easy to keep your data around for long-term analysis. And because data is stored in the cloud, accessing it is incredibly quick. Control global log retention policies from the Papertrail central interface. Updating the retention settings when your policies change is simply a matter of modifying settings in one place.
Sign up for a free plan
Diagnose issues in real time
Some issues are so important, only real-time analysis is capable of troubleshooting them. That’s why Papertrail supports a live tail feature that allows you to see incoming log messages as they’re received. Pause, search, and scroll through a live feed and apply filters in real time to gain insights into the behavior and health of your systems. Filter messages by time, origin, or custom fields such as session ID. The Papertrail CLI allows you to pipe and redirect live tail output onto the command line, and you can apply the same searches, filters, and log groups as you use in the web-based event viewer. The CLI also supports color highlighting so you can be certain you’ll never miss an important message. You can also use the CLI to convert live tail output into JSON format, making it easy to integrate with other tools and apps.
Sign up for a free plan
Monitor your services with alerts
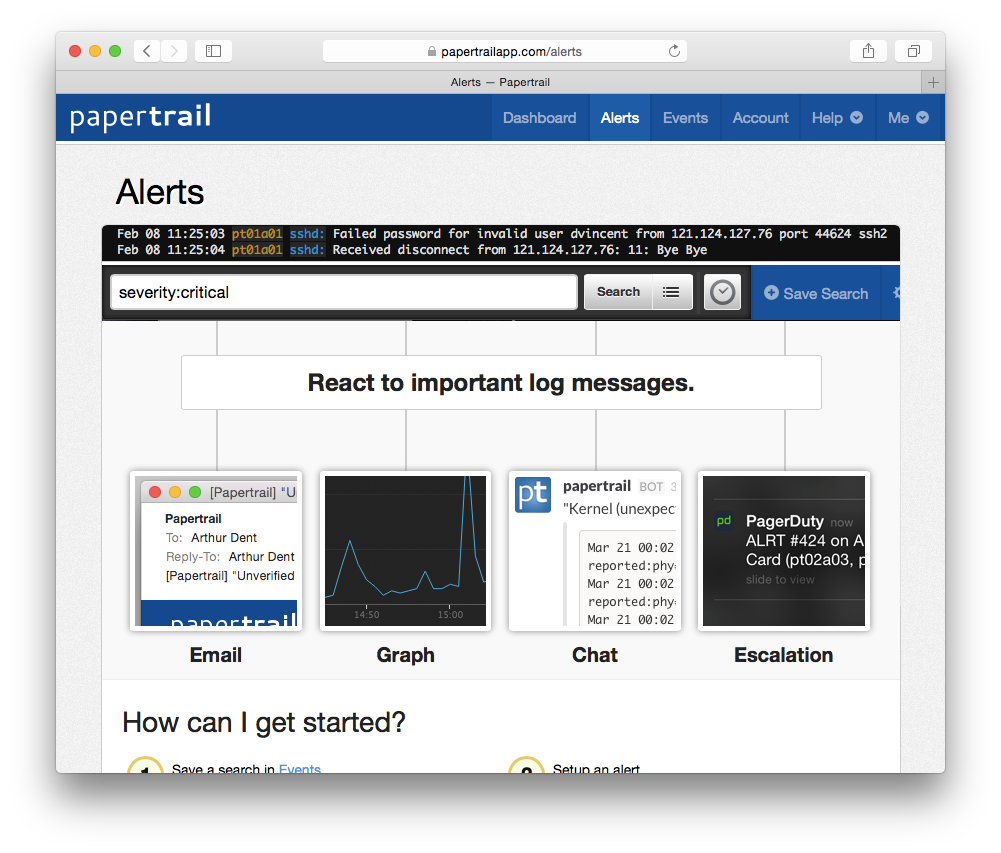
With Papertrail alerts, you can catch minor problems early before they become major incidents. Turn your saved searches into alerts by scheduling them to run every minute, hour, or day. Minimum thresholds for alerts allow you to specify the minimum number of events that need to occur before an alert is triggered. All this flexibility makes it easy to implement monitoring for rapidly-changing events, such as number of HTTP 404 responses as well as higher-level statistics like the number of daily active users. You can even trigger alerts when expected events don’t occur by using inactivity alerts. Receive notifications over email or third-party collaboration tools such as Slack, Campfire, and PagerDuty so your entire team is always kept in the loop. Alert notifications can also be sent using custom HTTP webhooks, meaning you can seamlessly integrate Papertrail alerts into your own monitoring tools.
Sign up for a free plan- Tomcat Logging
- Aggregate, monitor, and analyze all your logs in one place. Get the most out of your Tomcat logs with cloud-based log management software.