Last updated: September 2024
Logs are a ubiquitous component of IT. They come in all shapes and sizes from a wide variety of sources and possible destinations. But at the end of the day, all types of logging serve a fundamental role in a technological infrastructure: they allow a system to record information about its behavior to a persistent medium. People can then look at this information and reconstruct what happened so they can detect and fix whatever issues they might find.
What are logs?
Logs are records of events within an operating system, application, or service. They contain valuable information about the operation of these systems, including errors, warnings, and informational events. Logs are essential for troubleshooting, diagnosing problems, and understanding the behavior of a system over time.
In this post, you’ll learn some basic and more advanced techniques to filter your events and make them more manageable.
Covered in This Post:
- Overview of Windows Event Viewer
- The need for Log Filtering
- Log Filtering Techniques
- Filtering by Event Time
- Filtering by Event Level
- Filtering by Event IDs
- Advanced Log Filtering
- Using Custom Views
- Using XML Filtering
- Conclusion
- Considerations for Further Reading
Windows Event Viewer and how you access it.
Windows Event Viewer is a powerful tool for system administrators and power users. It helps you monitor and troubleshoot your Windows operating system. By reviewing event logs, you can diagnose system errors, security issues, and application problems.
What is Windows Event Viewer?
Windows Event Viewer records significant events on your computer. These events can include:
- System warnings and errors
- Application crashes
- Security events
Event Viewer categorizes these events into different logs. The most commonly used logs are:
- Application log: Records events logged by applications.
- System log: Records events logged by Windows system components.
- Security log: Records security-related events like login attempts.
How to Access Windows Event Viewer
Accessing Windows Event Viewer is simple. Follow these steps:
- Using the Start Menu
- Click on the Start button or press the Windows key.
- Type Event Viewer in the search bar.
- Click on Event Viewer from the search results.
- Using the Run Dialog
- Press Windows + R to open the Run dialog box.
- Type eventvwr.msc and press Enter.
- Using Control Panel
- Open the Control Panel.
- Navigate to System and Security.
- Click on Administrative Tools.
- Double-click on Event Viewer.
Why do we need to filter logs?
Filtering logs allows IT professionals to focus on the most relevant information, making it easier to identify and troubleshoot issues. By filtering logs, users can reduce the noise and extract actionable insights from the vast amount of data generated by their systems.
Log Filtering Techniques
Let’s start by covering some basic filtering options. Instead of showing you every possible option, I’m just going to cover the main ones so you can get the gist of it. With the basic options out of the way, we can continue to more advanced ones.
Filtering by Event Time
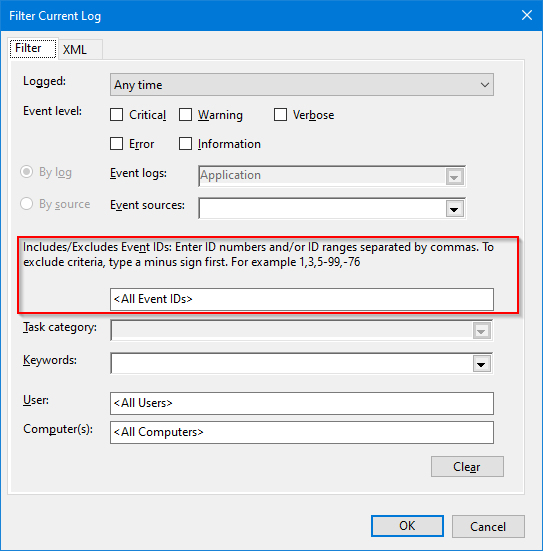
With the Event View window open, expand the Windows Logs option. Then, right-click Application and click on Filter Current Log.
In the newly opened window, you’ll see options you can use to filter the log. The first option is Logged, which refers to the time stamp for the event. Clicking the combo box next to the label allows you to see the existing options for this field:
- Any time
- Last hour
- Last 12 hours
- Last 24 hours
- Last 7 days
- Last 30 days
- Custom range…
Since all the other alternatives are self-explanatory, click on Custom range. You’ll see a new window like this:
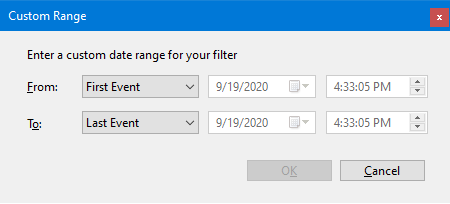
You’ll notice you can’t choose the date and time for the filter. To be able to choose the date and time for the “From” time stamp, click on the first combo box and change it to “Event On.” You can also do the same for the second time stamp.
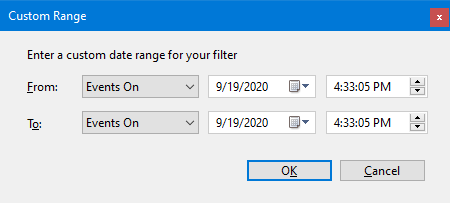
After configuring the dates to your needs, click OK. Then go back to the previous screen, click OK, and the filtering will occur.
Filtering by Event Level
Now, let’s filter by event level. Go back to the Event Viewer home screen, expand the Windows option again, and right-click one of the logs found there. Then, click on Filter Current Log.
Immediately after the options for filtering by time, you’ll see several boxes referring to event levels. You can check how many levels you want to filter by:
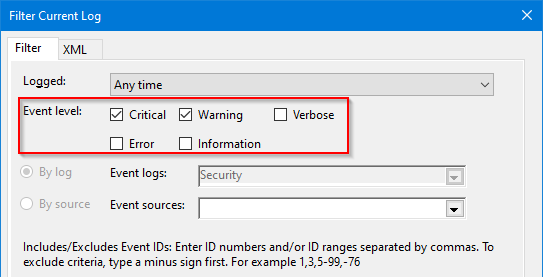
Click on OK when you’re ready, and the filtering will take place.
Filtering by Events IDs
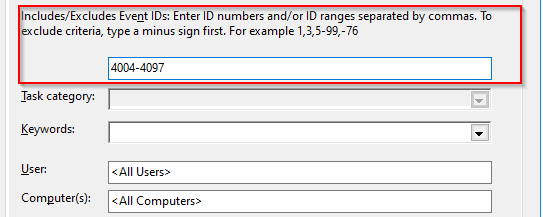
Before covering more advanced techniques, I’ll share a final tip. You can easily include or exclude events IDs. You just have to enter IDs separated by commas. To exclude a given ID, start with a minus sign. Ranges also work: you can use a minus sign to separate the first ID from the last.
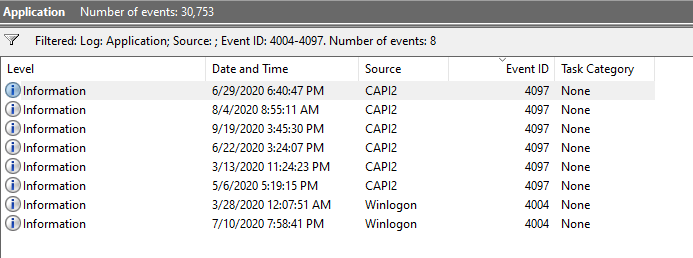
Both sides are inclusive, as you can see from the following example:
Advanced Log Filtering
With the basic filtering techniques out of the way, let’s focus on more advanced ones.
Using Custom Views
The filtering capabilities we’ve discussed so far might be enough if you have basic filtering needs, but they have limitations. If you have more advanced filtering needs, you need custom views. Custom views allow you to use exactly the information you need, combining events from different logs or different sources.
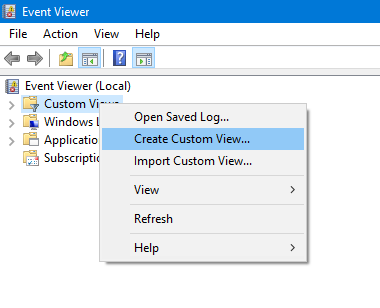
On the Event Viewer window, right-click on Custom Views and then click on Create Custom View:
For this example, these are the settings I’m picking:
- Logged: last 7 days
- Event level: critical and warning
- Event logs: application, security
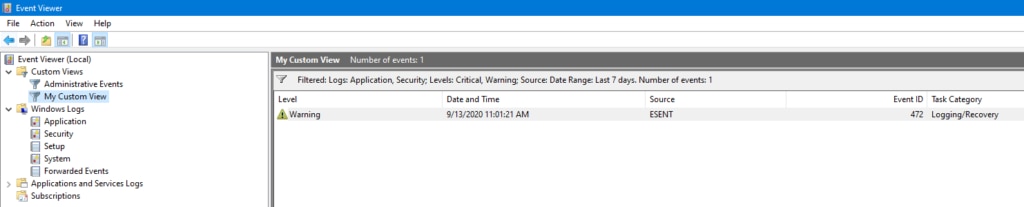
I’ll leave the remaining options with their default values. After clicking on OK, this is what you should see:
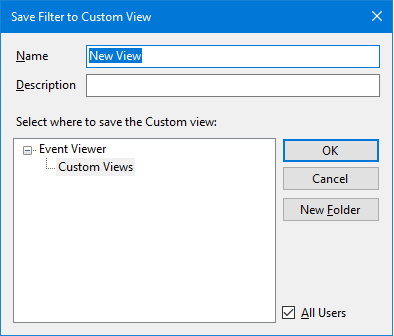
For the name, I’ll use My Custom View, and I’ll leave the description blank. After you’re done, click OK and you should see your brand-new custom view:
Using XML Filtering
The custom view you’ve just created is already an improvement over the basic filtering capabilities. However, we can take it even further. Let’s look at how we can use XML querying for more powerful filtering.
We’ll start by creating a new custom view. Repeat the process from the previous section: go to the Event Viewer window, right-click Custom Views, and click on Create Custom View.
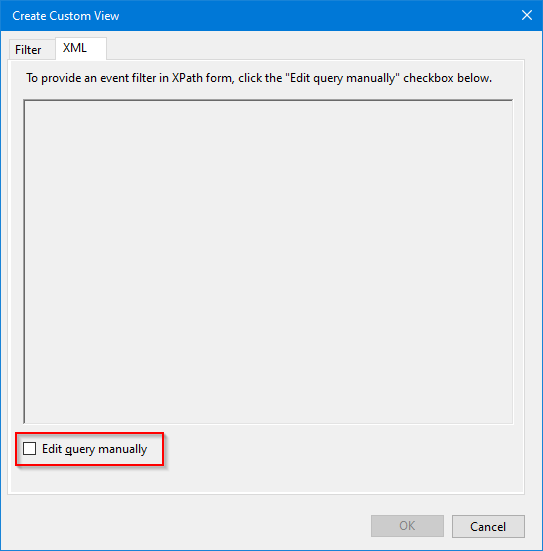
Here’s where things change. Instead of doing what you did the previous time, go to the XML tab and mark the Edit query manually box in the lower-left corner of the window:
After you click this checkbox, you’ll be prompted with the following message:
If you choose to manually edit the query, you will no longer be able to modify the query using the controls on the Filter tab. Would you like to continue?
Click Yes. You’ll then be allowed to write a filter using XML’s XPath syntax. Copy the following excerpt of code and paste it in the window:
<QueryList>
    <Query Id="0">
        <Select Path="Security">
            *[EventData[Data[@Name='SubjectUserName'] and (Data='testuser')]]
        </Select>
    </Query>
</QueryList>
Don’t forget, of course, to change “testuser” to an actual user name, keeping the quotes. Click OK and enter a name and a description for your custom view. Finally, click OK and your newly created custom view will be added to the list and you’ll be able to see its results.
Conclusion
Logs are a unique window into the depths of your technological infrastructure. Windows logs are no exception, but they can sometimes be frightening. It’s essential to have a way of making Windows events more manageable. Filtering your events is one such way. By using the filtering techniques described in this post, you’ll be able to quickly find the information you need according to your criteria.
However, even after learning and putting into practice the tips we’ve shared today, you may feel like you’re still spending too much time on Windows event logs. If this is the case, the next natural step is to consider the tools at your disposal and find one capable of handling both Windows event logs as well as logs from other systems. Consolidating your log data in one log management system can make your life much easier by simplifying and reducing the time you spend on troubleshooting, allowing you to concentrate on doing the work that generates the most value for your organization.
One tool you might want to consider is SolarWinds® Papertrail™. Papertrail is a cloud-based log management solution, and it’s quick to set up and easy to use. It can centralize logs from a huge variety of sources, including Windows event logs. It aggregates your log data and lets you search multiple sources from a single search bar. With its “live tail” function, you can even search and view real-time log data, which is particularly useful when troubleshooting and testing issue resolution.
For a more comprehensive performance monitoring, consider SolarWinds Observability SaaS (formerly known as SolarWinds Observability). SolarWinds Observability provides holistic observability across on-premise, hybrid, and cloud-native applications and infrastructure. Connecting data points from across your environment to deliver business insights and operational intelligence, SolarWinds Observability SaaS (formerly known as SolarWinds Observability) enables you to identify and resolve issues quickly.
—
This post was written by Carlos Schults. Carlos is a .NET software developer with experience in desktop and web development, and he’s now trying his hand at mobile. He has a passion for writing clean and concise code, and he’s interested in practices capable of helping you improve app health, such as code review, automated testing, and continuous build.