Last updated: October 2025
Routers play a key role in any network. If you’re like most network engineers, you usually spend most of your time working with routers (as opposed to other network devices). In smaller networks, routers may even be the only devices managing traffic. Router logs can provide valuable insights into your network. In this post, we’ll walk through how to analyze router logs efficiently.
Routers: What Are They Anyway?
Put simply, a router is a network device that manages network traffic. It can forward packets from one computer to another and from one network to another.
While it sounds relatively simple, routers do much of the work in a network and sometimes can even do the job of other devices (for example, a switch or a firewall). So, if you have any issues with your router, you’ll probably completely lose connectivity between the devices in your network and the internet. It’s crucial to identify and fix router-related problems as soon as possible.
Even if the issue is related to another device, because routers play such a central role in the network, analyzing router logs can help you spot the problem. And because any connection will eventually have to pass the router, managing router logs also helps with forensic security analysis. But with all this traffic, the volume of events can be overwhelming and hard to manage manually. Spotting anomalies in the volumes of ordinary traffic is difficult.
Let’s quickly look at what we mean by router logs.

What Are Router Logs, and Why Do We Need Them?
Router logs are essentially records of your router’s activities. These records are accessible by the Wi-Fi owner, Wi-Fi administrator, and your Internet Service Provider (ISP). The information obtained from your router provides valuable insights into the network’s traffic, network errors, authentication logs, system events such as firmware updates, and exceptions—including packet drops.
So why do we need router logs?
For starters, router logs play a vital role in network management by helping identify malicious activity, unauthorized access attempts, network congestion, and connectivity issues. Logs also provide insights into network traffic patterns, which can be used to maintain network utilization and ensure compliance, thereby serving as a source for adherence to security practices and internal policies.
In summary, by analyzing and visualizing logs, network administrators can proactively detect and mitigate network issues, leading to a more optimized and secure network infrastructure.
How do I check router logs?
To check your router logs, you first need to log in to your router’s web interface using your credentials. Depending on your specific router model, navigate to the System logs section under the Advanced or Admin settings.
Once you are in the System logs section, you can view the logs if they are already enabled. From here, you can filter, search, save, or download the logs. Now you can analyze your logs to gain valuable insights into the health of your network traffic.
What Router Logs Can Tell You
Whenever you’re facing network issues, you can probably find the cause in router logs. In most cases, you’ll find a simple configuration error causing the problem.
Let’s cover a few examples.
Allow/deny lists
Allow/deny lists are popular, firewall-like mechanisms built into most routers that allow you to allow or deny traffic based on the source or destination of the packet. For example, you might have forgotten to add a new IP address to the list. Unfortunately, identifying this issue on an affected computer can be challenging (because there are many reasons why a connection may not work). Looking at the router logs, however, can help you see if a particular computer was blocked because its IP address isn’t listed in the router’s allow list.
Protocol-based filtering/rules
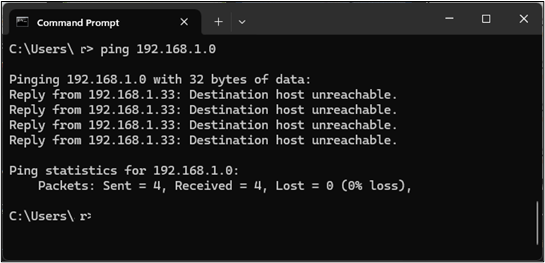
Many routers also filter traffic or apply special rules to it based on the protocol of the traffic. For example, a standard security practice is to block ICMP traffic. But it’s also a common practice to use a ping tool to check the connections. If a router blocks ICMP traffic, a ping command will fail, which may mislead you into thinking the system you’re trying to test isn’t available.
ARP protection
The Address Resolution Protocol (ARP), which is responsible for mapping hardware addresses to IP addresses, is crucial for any network to function correctly. Unfortunately, because ARP allows a spontaneous reply, ARP spoofing attacks exist. Some routers implement various mechanisms to prevent this form of attack. Sometimes, those mechanisms also block legitimate requests. Again, your best bet is to analyze logs to see if there’s a message indicating the ARP protection mechanism has been triggered.
Rejected connections
We covered a few examples above, but there are many other reasons a router may reject connections. Some routers have more built-in default security mechanisms than others. Whenever your connection isn’t correctly routed, you should see the reason in the router logs.

Access logs
Logs of the traffic flowing through the router aren’t the only logs you should be monitoring. You should also examine the access activity of the router itself, especially if you suspect a security issue. Antivirus software and firewalls can protect you from malware and phishing, but if someone gains access to your router, then the damage could be company- or network-wide.
To start, you should monitor both successful and failed login attempts. Why should you also monitor successful attempts? Because if someone logs in at 3 a.m. when you’re sure you and your team are offline, it may mean an unauthorized user has obtained your credentials. You should also monitor failed attempts for apparent reasons. One or two failed attempts can indicate someone forgot their password or made a typo. However, if you are experiencing more failed attempts over a prolonged period, it could indicate that someone is attempting to guess (or is performing a brute force attack to bypass) the credentials.
You should also monitor access attempts related to other services. The more feature-rich the router is, the more extra services it exposes. Some routers may allow SSH, Telnet, or VPN access. If you don’t use these additional services, it’s easy to forget about them. Analyzing all possible access logs provides a clear understanding of whether your router is secure or has been compromised.
How to Analyze Router Logs Efficiently
We covered the importance of analyzing router logs. Now let’s discuss how to do it efficiently.
Even in small environments, routers can produce a vast number of event messages. About 80% of the event messages, however, are generated through ordinary traffic. For example, making a new connection from one machine to another can produce more logs in a single second than you can follow. So, collecting and centralizing log messages is key.
Log aggregation
In small networks, there may be only one router. However, in most cases, for high availability and scalability reasons, multiple routers are used, which means there will be various sets of logs to find and analyze. To make it even more challenging, some routers require special software or are only accessible from a specific network segment. All this complexity can complicate troubleshooting. The best way to address this is to aggregate your logs, allowing you to analyze and search them when needed easily. One possibility is to use syslog for sending all the logs from routers and other devices to a centralized log management tool. This solves the challenges of locating scattered items across your environment. A cloud-based log aggregation tool is also highly scalable and can adapt to sudden spikes in log volumes that frequently arise when an issue occurs. This approach also opens new possibilities, which we’ll cover next.
Searching Through Centralized Logs
Aggregating logs from your routers into one place allows you to have a much better understanding of what’s happening across your network. Centralization on its own, however, is only part of the solution. You still need to know what to search for. Here are a few tips for making the process more efficient:
- Key events: Imagine if you forgot to add an IP address to a router’s allow list. From a router’s perspective, it will automatically block traffic from this IP address. You can’t just search for errors. You need to focus on key events and search for them specifically. For example, if there’s a problem with ICMP traffic, you’ll first need to filter logs for ICMP traffic and then pick a time span matching when the issue started. Alternatively, if there’s an issue with a specific host, you can filter the logs by the host’s IP or MAC address.
- Repetitive searches: If you notice you’re executing the same search queries multiple times, you can further streamline your troubleshooting by saving the searches. This will enable you to create a list of your most frequently used searches, name them accordingly, and utilize these custom searches to expedite the entire debugging process.
- Proactive alerts: To build on the idea of creating a saved searches list, if you frequently search for the same types of events, you might want to consider turning the search into an alert. This saves you the hassle of executing the same search each time and helps you catch issues quickly. Too many failed login attempts? Alert! Too many ARP updates? Alert!
Pick the Right Log Management Tool
Centralizing logging is a great way to analyze router logs and reduce the time spent troubleshooting. You can also speed up troubleshooting by saving searches and setting up proactive alerts. These capabilities, however, vary widely across log management tools. This makes it particularly important to choose a good log management tool. How can you tell which tool is best?
First and foremost, a good log management tool should allow you to aggregate all of your logs, not just network logs, but also logs from applications, services, and platforms. SolarWinds Papertrail, for example, aggregates logs from most sources.
Log aggregation saves you time by eliminating the need to search for logs across different systems, allowing you to search logs centrally and view events in context across devices, applications, and services. A good log tool, like Papertrail, will also offer a live tail function to let you view event messages as they’re written to the log. This capability will enable you to perform real-time troubleshooting and help you pinpoint issues more quickly.
Interactive visualization of event volume can be helpful when trying to identify when and where a problem occurred. Using the types of charts, you can quickly see when the event volume started increasing and spot trends. It’s excellent for rapidly focusing your troubleshooting efforts and understanding the scope of the systems impacted.
The importance of analyzing router logs can’t be neglected, and neither can the importance of a good tool for that purpose. Hopefully, you now know how to handle router logs and select the most suitable tool for the job.
This post was written by Dawid Ziolkowski. David has 10 years of experience as a Network/System Engineer at the beginning, DevOps in between, and Cloud Native Engineer recently. He’s worked for an IT outsourcing company, a research institute, a telco, a hosting company, and a consultancy company, so he’s gathered a lot of knowledge from different perspectives. Nowadays, he’s helping companies move to the cloud and/or redesign their infrastructure for a more Cloud Native approach.