Last updated: October 2025
Regardless of what language you code in or what type of apps you’re working on, you’re going to end up reading log files. They’re your window into what’s happening inside your code or the server you’re talking to. Linux log management is one of the skills that sets an experienced developer apart from the rest.
The good news is that Linux has a broad array of tools for searching and filtering log files. Like most system administration tasks, there’s more than one way to tackle this task.
Viewing and Tailing Logs
Let’s start by reviewing the last few messages in a file and following a log in real-time.
Start with the tail
This article has tail right there in the title, so let’s start there.
Log files tend to grow in size, making it difficult—if not impossible—to open them in an editor like vi. Opening a large file in an editor consumes a significant amount of memory and will begin to utilize disk space if you make any changes. Your system may not be able to handle the load, or it could interfere with a production process.
That’s where tail comes in.
egoebelbecker@latveria:/var/log$ tail auth.log
Nov 30 14:50:23 latveria sshd[84245]: Received disconnect from 192.168.7.53 port 63089:11: disconnected by user
Nov 30 14:50:23 latveria sshd[84245]: Disconnected from user egoebelbecker 192.168.7.53 port 63089
Nov 30 14:50:23 latveria sshd[84164]: pam_unix(sshd:session): session closed for user egoebelbecker
Nov 30 14:50:23 latveria systemd-logind[760]: Session 230 logged out. Waiting for processes to exit.
Nov 30 14:50:23 latveria systemd-logind[760]: Removed session 230.
Nov 30 14:50:24 latveria sshd[84309]: Accepted publickey for egoebelbecker from 192.168.7.53 port 63270 ssh2: RSA SHA256:rzKp/Dyg4Xm2ieYndTB8OWHSXFty4cNuYj7Uj5c0UvE
Nov 30 14:50:24 latveria sshd[84309]: pam_unix(sshd:session): session opened for user egoebelbecker by (uid=0)
Nov 30 14:50:24 latveria systemd-logind[760]: New session 231 of user egoebelbecker.
Nov 30 15:17:01 latveria CRON[84403]: pam_unix(cron:session): session opened for user root by (uid=0)
Nov 30 15:17:01 latveria CRON[84403]: pam_unix(cron:session): session closed for user root
The default behavior for tail is to read the last 10 lines of a file. It does this without reading the entire file first, so the file size is irrelevant.
You can view greater or fewer than 10 lines by adding an argument to your command.
egoebelbecker@latveria:/var/log$ tail -n 5 auth.log
Nov 30 14:44:44 latveria systemd-logind[760]: New session 228 of user egoebelbecker.
Nov 30 14:44:44 latveria systemd: pam_unix(systemd-user:session): session opened for user egoebelbecker by (uid=0)
Nov 30 14:47:12 latveria sshd[84164]: Accepted publickey for egoebelbecker from 192.168.7.53 port 63089 ssh2: RSA SHA256:rzKp/Dyg4Xm2ieYndTB8OWHSXFty4cNuYj7Uj5c0UvE
Nov 30 14:47:12 latveria sshd[84164]: pam_unix(sshd:session): session opened for user egoebelbecker by (uid=0)
Nov 30 14:47:12 latveria systemd-logind[760]: New session 230 of user egoebelbecker.
So, if you’re dealing with a gigantic log file and want to see what’s going on for the last few hundred lines, give tail the number of lines, pipe it to more, and page through the results.
egoebelbecker@latveria:/var/log$ tail -n 200 auth.log|more
Nov 29 00:17:01 latveria CRON[77383]: pam_unix(cron:session): session opened for user root by (uid=0)
Nov 29 00:17:01 latveria CRON[77383]: pam_unix(cron:session): session closed for user root
Nov 29 01:17:01 latveria CRON[77928]: pam_unix(cron:session): session opened for user root by (uid=0)
Nov 29 01:17:01 latveria CRON[77928]: pam_unix(cron:session): session closed for user root
Nov 29 02:17:01 latveria CRON[78339]: pam_unix(cron:session): session opened for user root by (uid=0)
Nov 29 02:17:01 latveria CRON[78339]: pam_unix(cron:session): session closed for user root
Nov 29 03:10:01 latveria CRON[78380]: pam_unix(cron:session): session opened for user root by (uid=0)
Nov 29 03:10:01 latveria CRON[78380]: pam_unix(cron:session): session closed for user root
Nov 29 03:17:01 latveria CRON[78399]: pam_unix(cron:session): session opened for user root by (uid=0)
Nov 29 03:17:01 latveria CRON[78399]: pam_unix(cron:session): session closed for user root
Nov 29 03:30:01 latveria CRON[78417]: pam_unix(cron:session): session opened for user root by (uid=0)
Nov 29 03:30:01 latveria CRON[78417]: pam_unix(cron:session): session closed for user root
Nov 29 03:47:01 latveria CRON[78435]: pam_unix(cron:session): session opened for user root by (uid=0) • More--
Chasing the tail
You’re probably already familiar with using the tail command with the -f argument (--follow) to follow a file as it updates.
This is an everyday use for tail and is helpful for integration testing or troubleshooting problems in situ.
But what if you want to go back and look at something you missed while following the file? What if, as mentioned above, the file is too big to open with an editor or page through screen by screen with more?
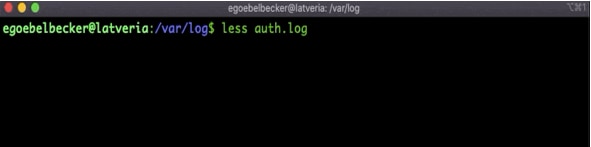
Less is more (and more!)
less works like more. It displays a file’s contents page by page—like more does—but it does much more than that. You can scroll forward with the space bar, just like you would with more. But you can scroll backward with b and search for text with / and ?, similar to how you would within vi.
That’s just the tip of the iceberg for less, but there’s one more feature that’s especially convenient for logs. It can follow them—similar to tail -f—but it’ll also let you page and search through the file without reopening it, too.
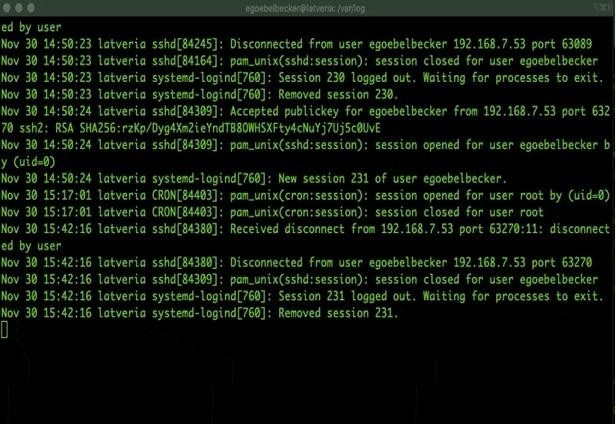
If you already have a file open, press f to start following it. less will move to the end and wait for an update.
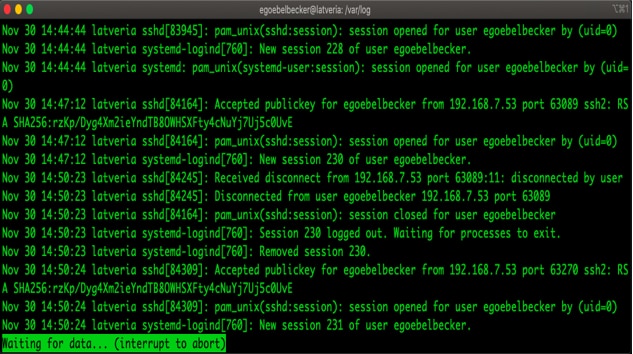
If something scrolls by and you want to scroll back and see it, press Ctrl+C, and less will stop waiting for updates. Now you can scroll back or use the search function. To resume reading updates, press f again.
Filtering Logs
Reading logs as they’re updated is helpful for testing and can be a good way to isolate a problem, but sometimes you need to go back and search through a log file to see what happened in the past.
This is where searching and filtering play a role. less can do some of this work for you since you can search forward with / and back with ?.
It’s also worth mentioning view, which runs vi in read-only mode. This makes it safe to open huge files.
grep
For filtering, grep is the workhorse most people turn to, and for good reason. You can use it to search for a basic regular expression by pasting it on the command line.
egoebelbecker@latveria:/var/log$ grep egoebelbecker auth.log |more
Nov 29 16:54:32 latveria sshd[79348]: Accepted publickey for egoebelbecker from 192.168. 7.131 port 33366 ssh2: RSA SHA256:P9Ot2rSd5MMXAdTF4nVjEpQQFnO07sEL0AWZX/RDkYk
Nov 29 16:54:32 latveria sshd[79348]: pam_unix(sshd:session): session opened for user eg oebelbecker by (uid=0)
Nov 29 16:54:32 latveria systemd-logind[760]: New session 200 of user egoebelbecker.
Nov 29 17:01:18 latveria sshd[79490]: Disconnected from user egoebelbecker 192.168.7.131 port 33366
Nov 29 17:01:18 latveria sshd[79348]: pam_unix(sshd:session): session closed for user eg oebelbecker
Nov 30 00:09:31 latveria sshd[81080]: Accepted publickey for egoebelbecker from 192.168. 7.53 port 64605 ssh2: RSA SHA256:rzKp/Dyg4Xm2ieYndTB8OWHSXFty4cNuYj7Uj5c0UvE
Nov 30 00:09:31 latveria sshd[81080]: pam_unix(sshd:session): session opened for user eg oebelbecker by (uid=0)
Nov 30 00:09:31 latveria systemd-logind[760]: New session 208 of user egoebelbecker.
Nov 30 00:13:45 latveria sudo: pam_unix(sudo:auth): authentication failure; logname=egoe belbecker uid=1000 euid=0 tty=/dev/pts/1 ruser=egoebelbecker rhost= user=egoebelbecker
Nov 30 00:13:51 latveria sudo: egoebelbecker : TTY=pts/1 ; PWD=/var/log ; USER=root ; CO MMAND=/usr/bin/su
Nov 30 00:13:51 latveria sudo: pam_unix(sudo:session): session opened for user root by e goebelbecker(uid=0)
Nov 30 00:13:52 latveria su: (to root) egoebelbecker on pts/1
Nov 30 00:13:52 latveria su: pam_unix(su:session): session opened for user root by egoeb elbecker(uid=0) • More--
In this case, the result was more than a page long, so I piped it through more. I could have used less, but it would’ve cleared the screen and removed the grep command.
Regular expressions
Basic regular expressions will get you a long way, but sometimes you need to step things up with an extended regular expression. These expressions support a larger set of metacharacters.
Let’s say our example server has connectivity to two different subnets: 192.168.7.X and 192.168.1.X. We want to grep for logins from either one, so we need the or | operator.
egoebelbecker@latveria:/var/log$ grep -E '192.168.7|192.168.1' auth.log |more
Nov 29 16:54:32 latveria sshd[79348]: Accepted publickey for egoebelbecker from 192.168.1.131 port 33366 ssh 2: RSA SHA256:P9Ot2rSd5MMXAdTF4nVjEpQQFnO07sEL0AWZX/RDkYk
Nov 29 17:01:18 latveria sshd[79490]: Received disconnect from 192.168.7.131 port 33366:11: disconnected by user
Nov 29 17:01:18 latveria sshd[79490]: Disconnected from user egoebelbecker 192.168.1.131 port 33366
Nov 30 00:09:31 latveria sshd[81080]: Accepted publickey for egoebelbecker from 192.168.7.53 port 64605 ssh2 : RSA SHA256:rzKp/Dyg4Xm2ieYndTB8OWHSXFty4cNuYj7Uj5c0UvE
Nov 30 00:14:15 latveria sshd[81329]: Accepted publickey for egoebelbecker from 192.168.7.53 port 64715 ssh2 : RSA SHA256:rzKp/Dyg4Xm2ieYndTB8OWHSXFty4cNuYj7Uj5c0UvE
Nov 30 02:26:51 latveria sshd[81227]: Received disconnect from 192.168.7.53 port 64605:11: disconnected by u ser
Nov 30 02:26:51 latveria sshd[81410]: Received disconnect from 192.168.7.53 port 64715:11: disconnected by u ser
Nov 30 02:26:51 latveria sshd[81227]: Disconnected from user egoebelbecker 192.168.7.53 port 64605
Nov 30 02:26:51 latveria sshd[81410]: Disconnected from user egoebelbecker 192.168.7.53 port 64715
Nov 30 14:44:44 latveria sshd[83945]: Accepted publickey for egoebelbecker from 192.168.7.53 port 62966 ssh2 : RSA SHA256:rzKp/Dyg4Xm2ieYndTB8OWHSXFty4cNuYj7Uj5c0UvE • More--
Line numbers
Sometimes you want to find a set of lines within a large log file. Crafting a regular expression to catch all of them would be too difficult. So, what we need is a line number. grep can do this for you, too. Let’s say we’re looking for one of my logins to the sample server. We’ll look for port 53799.
egoebelbecker@latveria:/var/log$ grep -n 53799 auth.log
165:Nov 30 17:06:25 latveria sshd[84705]: Accepted publickey for egoebelbecker from 192.168.1.53 port 53799 ssh2: RSA SHA256:rzKp/Dyg4Xm2ieYndTB8OWHSXFty4cNuYj7Uj5c0UvE
The -n option tells grep to include the port number with the search result. Now we can open the file in view or less, then go to line number 165.
What’s Next for Linux Log Management?
We covered how to use tail, less, view, grep, and more to follow and filter logs. With these tools, you have most of what you need for Linux log management. You can follow, search, and filter your log files regardless of their size. Depending on your needs, you can combine these tools to tackle almost any situation.
But this is only the beginning. You can use your logs to generate alerts and stay on top of software problems and application issues in real-time, without needing to monitor a screen constantly. To get started, sign up for a free SolarWinds Papertrail trial today.