Last updated: October 2025
As an IT professional, you’ll find that log messages are one way to catch errors and solve your problems. As much as log messages are helpful, they can be confusing because a lot of messages—even the log messages you don’t need to see—are generated by the server. Instead of making your life easier, log messages can make things harder for you because unnecessary error messages are being logged.
In this post, I’ll show you how you can filter log messages and make them helpful in solving your application and infrastructure problems. Every developer—whether a newbie or a senior developer—has dealt with errors in their development environment, affecting professionals of all seniority levels. If you want to speed up the process of using a log message to resolve errors, stick around.
What Is a Log Message?
Almost every developer or IT professional can answer the question “What is a log message?” Here’s a brief definition of a log from Wikipedia:
In computing, a log file is a file that records either events that occur in an operating system or other software runs, or messages between different users of a communication software. Logging is the act of keeping a log. In the simplest case, messages are written to a single log file.
A log file doesn’t contain a single message, but many messages. Because of this, you’re likely to see unwanted log messages in a log file. To avoid this, you’ll need to find a way to filter the logs—to see only what’s useful for your needs—which is, of course, to solve a problem or keep a record of something.
What Is Log Filtering?
Log filtering is the process of selecting relevant log data from a log file based on specific criteria. You can define your filtering criteria based on various log attributes, such as log level, context, message content, or timestamp. You can filter logs based on severity and importance using the log levels.
In addition to the levels, you can include metadata such as user IDs, session IDs, or request IDs to provide further context. This will help you categorize log information.
Using regular expressions or keyword matching can help you filter logs based on the content within log messages. Sometimes, you may want to get log information from a specific period. Here, you can filter the logs based on their timestamps or a particular range of time.
Log filtering can occur at various stages. You can filter at the application level using the built-in log filtering feature. You can also filter logs in transport or when ingested by a centralized logging tool. When the logging tools ingest the logs, you can leverage the filtering capabilities offered by the tools or services.
Why Do We Need Log Filtering?
We need log filtering to manage logs, which helps reduce log volume. Here is a breakdown of the primary reasons why we need log filtering:
Noise Reduction
The sheer volume of log messages can become overwhelming without proper log filtering. This makes it challenging to identify and analyze log data. Log filtering allows you to filter out unnecessary noise and focus on the relevant logs tailored to your specific needs.
Readability and Clarity
Logs may include irrelevant or redundant information. By filtering out unnecessary logs or focusing on specific log levels, components, or contexts, you can improve the readability and clarity of your log output. As a result, you can easily identify and analyze relevant events.
Compliance
Log filtering helps ensure that you retain only the necessary logs, thereby minimizing unnecessary data. This makes compliance easier and audits more manageable. For example, to comply with GDPR, you should filter and store logs that contain user consent records or data access logs.
Optimized Performance
Processing and storing large log volumes can be resource-intensive. However, filtering logs reduces the amount of data that needs to be processed, stored, and analyzed, leading to improved performance and lower costs.
Efficient Debugging and Troubleshooting
Log filtering can help you quickly isolate and focus on the relevant log messages related to a specific context, user, request, or component. This targeted filtering can significantly accelerate debugging and troubleshooting by reducing the noise and highlighting the relevant information.
How Can You Filter a Log File and Find Relevant Log Messages?
Most of us spend too much time searching through logs, hunting for information we can use to troubleshoot a problem. Log messages can be long and hard to understand, and even unhelpful messages for troubleshooting will still be logged. Here are key ways you can filter a log file to focus on the messages that matter.
#1: Use a grep command
Running a grep command helps you find a keyword that leads to the message you want to see in the log file. grep is a command-line tool you can use to find a certain string in one or more files, depending on the regular expression pattern. Here’s an example of using grep on the Linux terminal:
cat logfile.txt | grep 'FAILURE' > new_logfile.txtLet’s say you have a large file and you want to trace the line with the keyword FAILURE. Running the above command in the terminal will generate a new log file (named new_logfile.txt). This will help you quickly identify the error message and act on it.
You can also negate the lookup like this:
cat logfile.txt | grep -v 'FAILURE' new_logfile.txtSince FAILURE is the keyword used with the invert-match argument (-v), the command will search the file and omit the lines with the word FAILURE.
#2: Use the awk Command
awk is a scripting language used to manipulate data, and it’s one of the best commands in Linux. From the documentation, awk is “a program that you can use to select particular records in a file and perform operations upon them.” You can use it to process a log file by searching through it.
According to your needs, you can write commands to search for a particular selection. If you want to delve deeper into awk, you should consult its documentation. Here’s a basic example using awk in the terminal.
awk 'error' input-file.txt > output-file.txtawk will search the file and find any matches of the keyword error. You can also apply a regular expression here to specify the search criteria. For example, if you want to search lines starting with the error keyword, you would do this:
awk '^error' input-file.txt > output-file.txtJust like with the previous command, awk will output the matching keyword to a file named output-file.txt.
#3 Use a programming language
Many programming languages have a way for you to log messages from the server and save them in a text file. I’ve worked with both the Python and Django frameworks, and I found the Django framework to be more efficient for logging messages. The language you’re using can provide you with greater flexibility to write scripts tailored to your specific needs, giving you more control.
Here’s an example you can use to filter logs in Python:
import logging logger = logging.getLogger(__name__)
class LogFilter(logging.Filter):
	def filter(self, record):
		return record.getMessage().startswith('keyword')

logger.addFilter(LogFilter())
The filtering implementation above will log only event messages containing the specified keyword. You can also filter by specifying the level of log message with just a few lines of code in Python. For example, to log only ERROR messages, do this:
import logging
logger = logging.getLogger(__name__)

class LoggingErrors(logging.Filter):
	def filter(self, record):
		return record.levelno == logging.ERROR

logger.addFilter(InfoFilter())
#4: Use regular expressions (regex)
You can also use regular expressions (regex) to filter logs. Regex can help filter your logs to get precisely what you want to see from the log message. It also gives the flexibility of writing an expression of your choice. This can be particularly handy when dealing with a log file that contains more complex filtering.
We already discussed using grep for searching text files. Using it with regular expressions makes it even more powerful.
For example, if you want to filter IP addresses from a log file with text and digits, you can write a regular expression to get only digits and dots (since an IP address is made of digits connected by dots). A helpful but straightforward regex combined with grep can look like this:
grep -o '\d\d*\.\d\d*\.\d\d*\.\d\d*'The result will be a well-formatted IPv4 address, with four sets of digits separated by dots, such as 64.242.88.10.
#5: Use the tail command
tail, a command for Unix-like operating systems, is another helpful tool to work with. If you specify a number, it outputs that number of lines from the end of a file. By default, the tail command will output the last 10 lines. When used with -n, tail lets you specify the number of lines you want to be output from the file. For example, perhaps you simply want to see the last line of a file that contains thousands of lines of logs. Using tail is as simple as this:
tail -n 1 /usr/share/dict/file.logIf you want the last five lines from a log file, simply increase the number with the -n argument (for example: -n 5). The tail command also lets you monitor (“follow”) file changes in real-time. Just pass -f. For example:
tail -f /usr/share/dict/file.log#6: Use PowerShell
You can use PowerShell to log messages from the server. The Microsoft documentation describes PowerShell this way:
PowerShell is a cross-platform task automation and configuration management framework, consisting of a command-line shell and scripting language. Unlike most shells, which accept and return text, PowerShell is built on top of the .NET Common Language Runtime (CLR) and accepts and returns .NET objects.
Here’s an example of using PowerShell to return the last 50 error event logs:
Get-WinEvent -FilterHashtable @{logname='system'; level=2} -MaxEvents 50-FilterHashtable helps us map the key and value. In the above command, we’re looking for system event logs with the level set to 2, which essentially echoes error messages.
Conclusion
In most log files, it can be challenging to find the exact thing you’re looking for, whether that’s an error message or a specific string. Applying some filtering makes your work easier and less tedious.
Many servers run Linux or a Unix-like operating system. This makes using Linux commands such as grep, tail, and awk even easier.
In some cases, you don’t want to write any commands or lines of code to filter the log file. Fortunately, some systems are designed to help you filter logs and provide precise results in real time.
If writing commands and regular expressions is not your thing, you can try SolarWinds Papertrail, a cloud-hosted log management system designed to consolidate your log files and allow you to search them from a single interface.
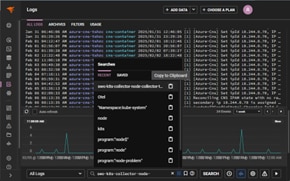
You can use SolarWinds Papertrail to filter, search, and analyze your log messages. Papertrail provides a powerful yet simple search syntax similar to a Google search. You can use Boolean operators such as AND and OR to filter results, and you can find log messages that don’t contain a string by using the negation operator (-).
Papertrail also offers a live tail feature, which works just like running a tail -f on a log file. It allows you to view new events as soon as they’re received. Using the live tail feature along with the log velocity graph-which visually presents the changes in event messages over time-allows you to zero in on hotspots and focus your troubleshooting.
Whether you spend a lot of time searching logs or look at them when something breaks, SolarWinds Papertrail, simplifies log filtering and searching. Start a free trial today and see how easy searching logs can be.
This post was written by Mathews Musukuma. Mathews is a software engineer with experience in web and application development. Some of his skills include Python/Django, JavaScript, and Ionic Framework. Over time, Mathews has also developed interest in technical content writing.