Real-Time Log Analysis
-
Aggregate and parse all your logs
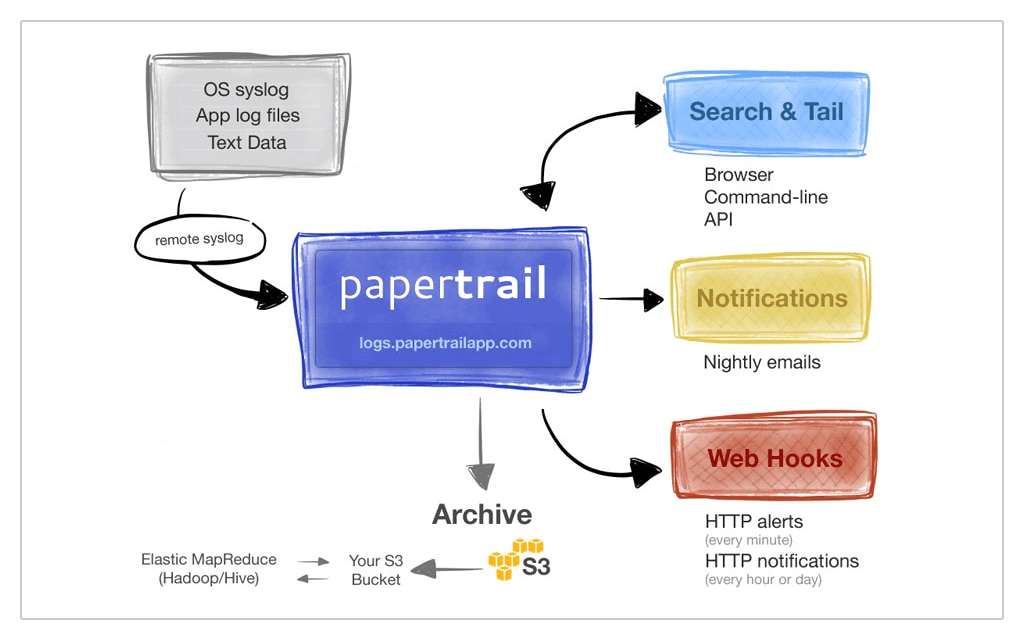
Consolidate all your logs into a single place and automatically parse and scan syslog messages to detect problems. -
Troubleshoot faster
Quickly retrace the chain of events leading up to an incident. -
Expose trends sooner
Visually explore log data to identify patterns before they affect your users.

Here's How Papertrail Helps

Aggregate and parse all your logs
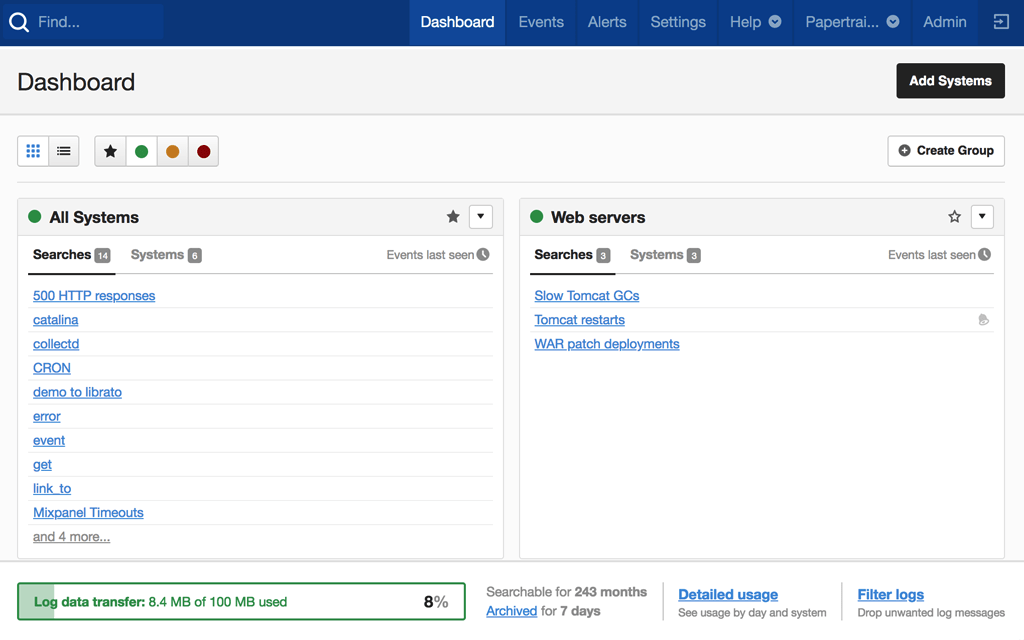
By consolidating all your syslog messages in the cloud, you can automatically parse and search through them to better understand your apps and services. All of your logs are stored in an Amazon S3 bucket, so you can access them quickly. Even if you’re working with huge volumes of log files, storage capacity in the cloud can scale seamlessly to meet your logging demands. Archive your logs for long-term analysis and to meet retention policies. With all your logs in one place, it’s easy to configure access control for users on your team. Assign read-only or full access permissions to users and grant the ability to purge log files to only those team members that need it. SolarWinds® Papertrail™ allows you to control global retention policies with an intuitive UI. If your retention policies ever change, updating them is as simple as changing the period in the Papertrail configuration settings and clicking save.
Sign up for a free plan
Troubleshoot faster
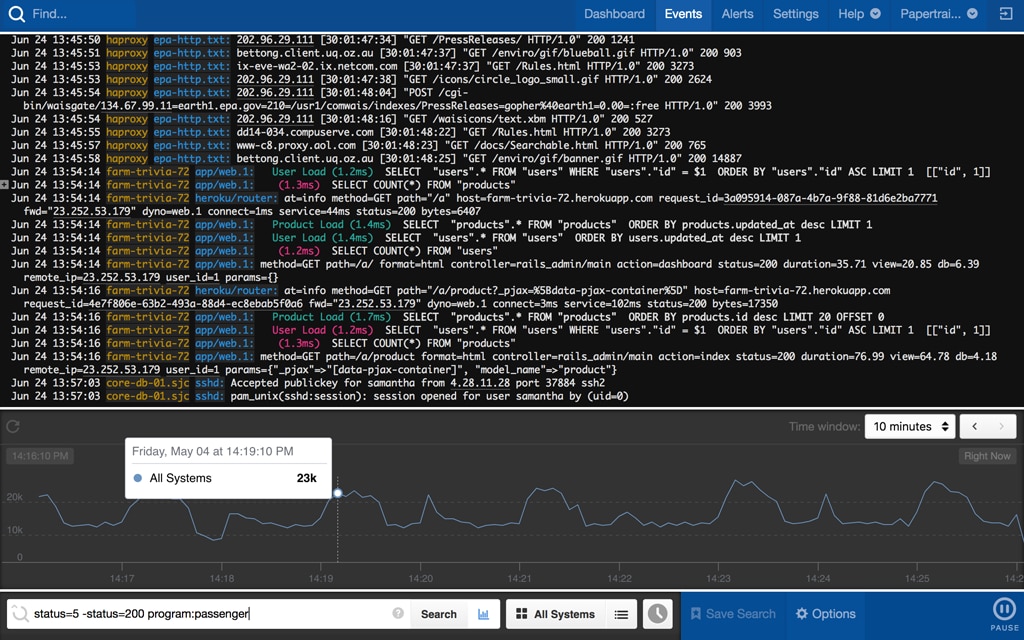
It can be difficult to discover which log messages are related to a specific event when troubleshooting. Papertrail offers context searches that help establish the chain of events leading up to an incident. View all messages immediately before a machine crash by clicking on the hostname in the Event Viewer, or find all log messages related to an individual user’s requests by clicking on a user ID. Context searches also make it easy to view all the parts in a multi-line log message. If you’re working with huge log volumes, you can trim them down by filtering log messages based on time, origin, or custom fields such as session ID. If you need to refine your log data even further, you can use powerful regular expressions to match log messages no matter which format they’re using.
Sign up for a free plan
Expose trends sooner
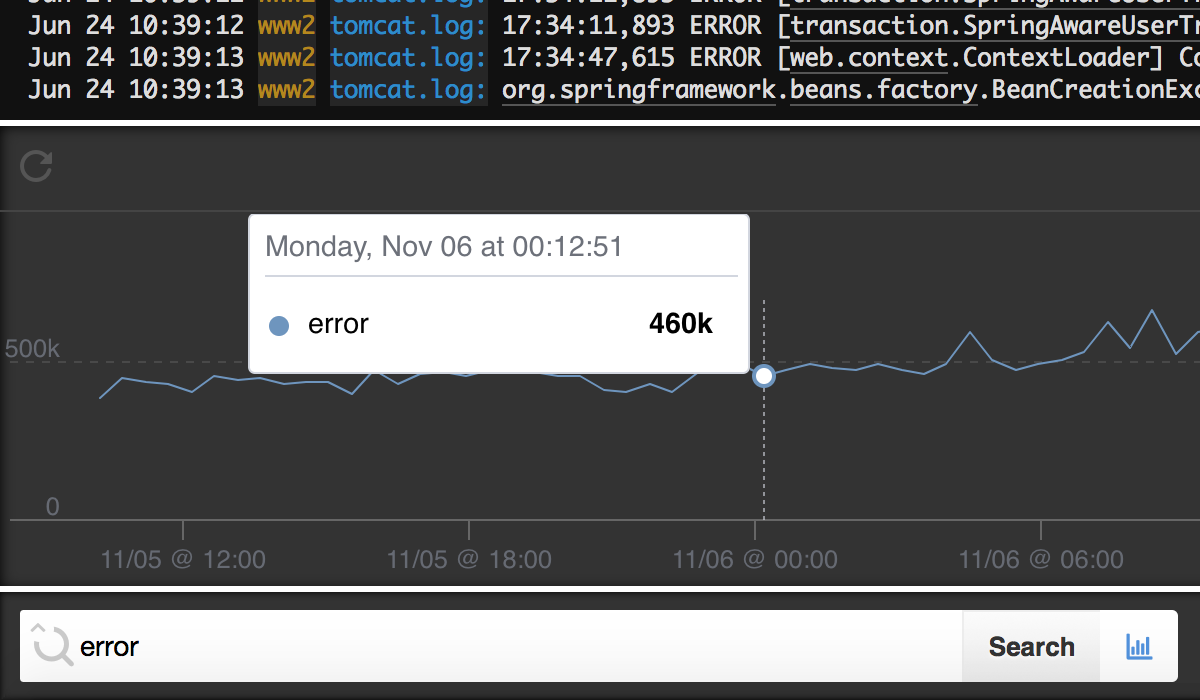
Some patterns and anomalies can only be seen when looking at aggregated Syslog messages with charts and graphs. Log velocity analytics allow you to transform your log data into interactive visualizations to make it easier to spot worrying trends, so you can take action before they affect your users. Identify trends by looking at historical log data, such as the number of app errors over the last two weeks, or troubleshoot traffic spikes by restricting the log data period to the last ten minutes. Log velocity analytics lets you quickly switch between a high-level picture and low-level details. By simply clicking on a specific time on the graph, you can dive into the event details to understand the chain of events and reduce the time to uncover insights into your systems and apps.
Sign up for a free plan- Syslog Analyzer
- Aggregate, monitor, and analyze all your logs in one place. Get the most out of your syslog messages with cloud-based log management software.Looking for something more advanced? Check out the SolarWinds event log analyzer tool