Simplify Python log management
-
Bring all your logs together
Centralize your logs without losing the benefits of storing files locally. -
Query your logs to uncover insights
Use interactive search features to query your log data and unearth key insights. -
Reduce the time to discover and fix issues
Locate and fix issues faster by visualizing event volume and spotting trends over time.

Here's How Papertrail Helps

Aggregate all your Python logs
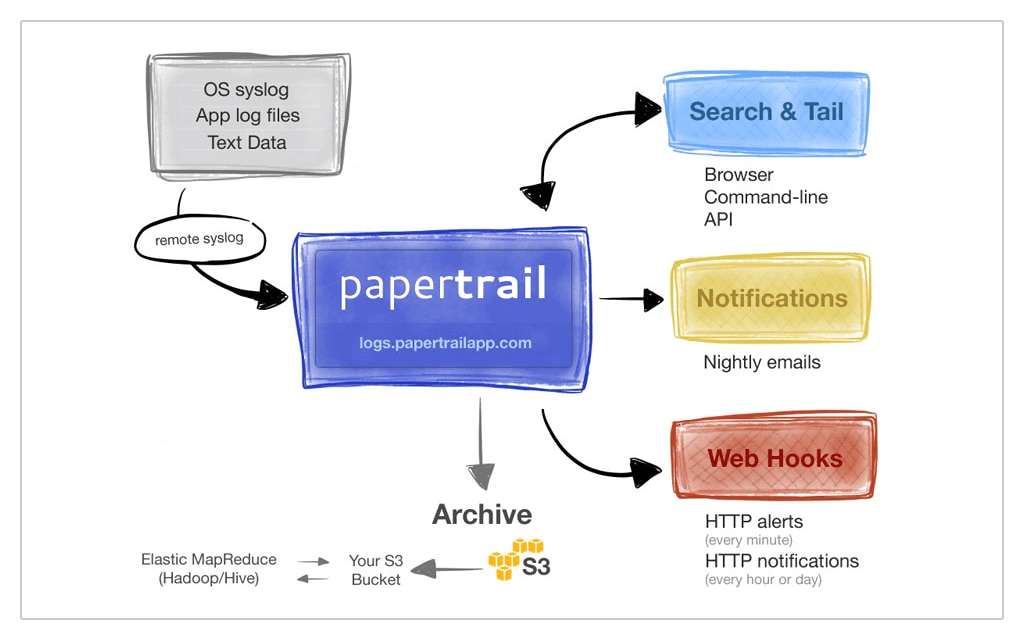
The Python sysloghandler class can forward log messages directly to SolarWinds® Papertrail™, allowing you to consolidate log files from across your environment into a single location. Simply use the log destination from your Papertrail account when instantiating a sysloghandler object and you can start sending log messages immediately. With all log files stored centrally in one place, you no longer need to SSH to your servers to inspect their local log files. Use the central event viewer to gain visibility into all your Python application logs no matter where they came from, and search through hours of logs in seconds.
Sign up for a free plan
Query your logs to uncover insights
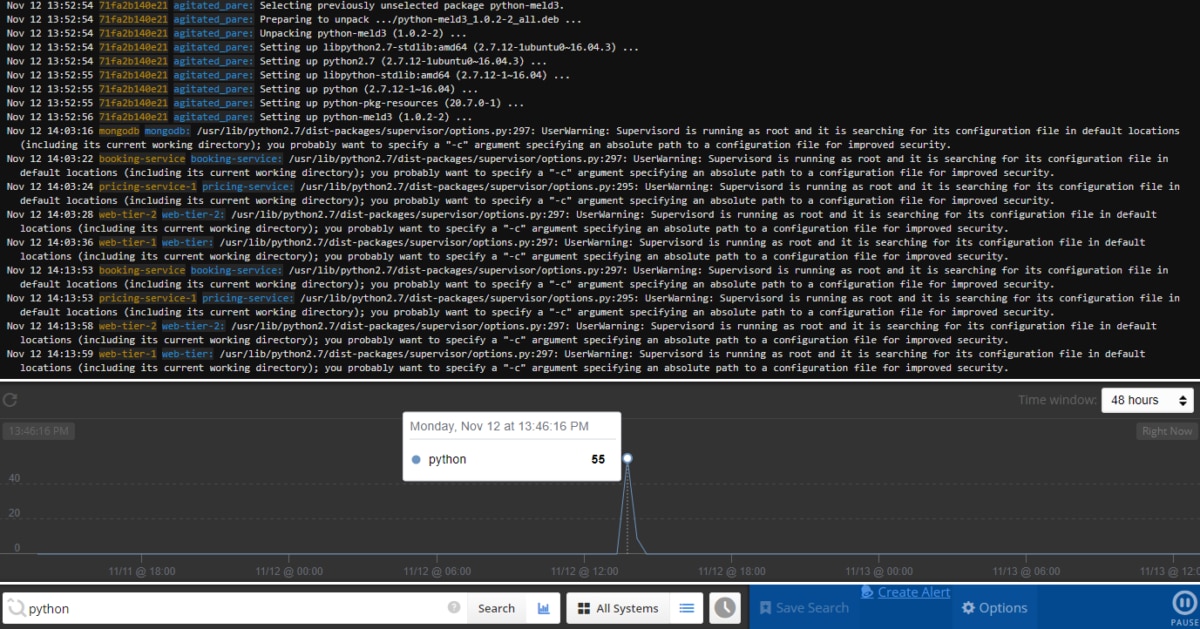
Discover the root cause of issues and problems by querying your Python log data with advanced searching and filtering. Comb through log data with an intuitive search syntax and cut through the noise with exclusion searches to home in on the messages that really matter. Seek through logs by time and jump to events from a specific time with just two clicks. Clickable log elements allow you to find related log messages by clicking on IP addresses, user IDs, and UUIDs, and build an infrastructure-wide history of events. Retrace all the log messages leading up to a kernel crash by clicking on the sender hostname or click on a user ID to see a list of transactions.
Sign up for a free plan
Discover and fix issues faster
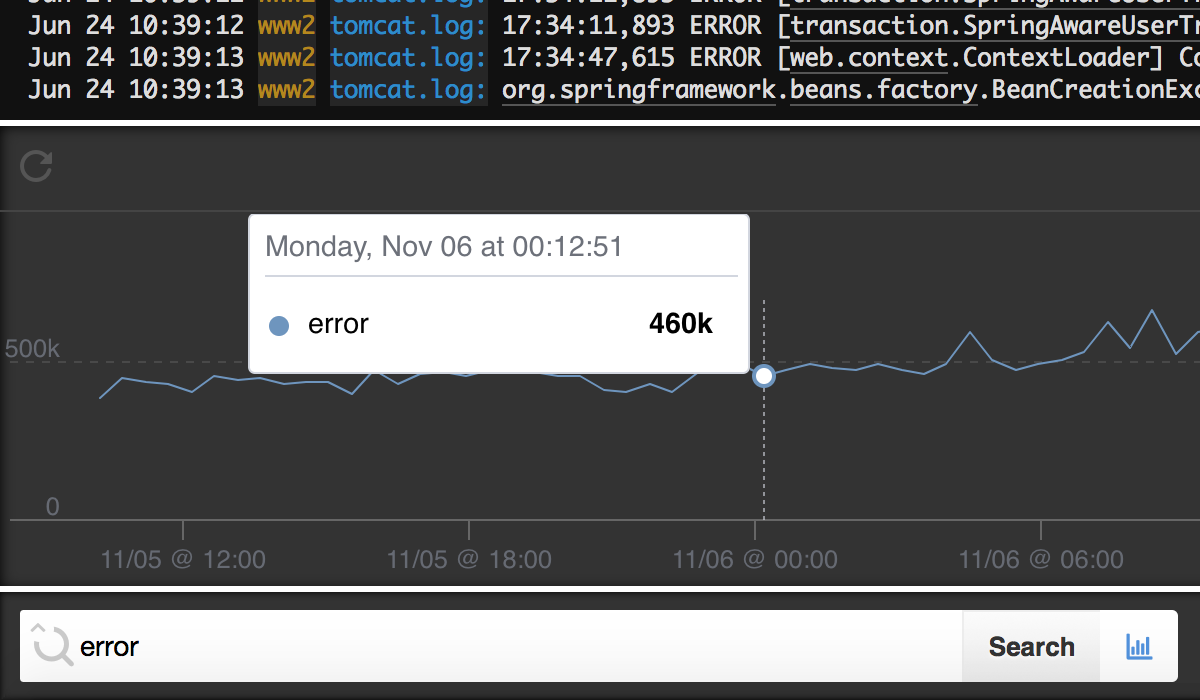
Finding patterns and trends in masses of log data can be difficult without the right tools. Log velocity analytics lets you create interactive visualizations of your log data that you can query to understand traffic spikes, increasing error rates, and other behaviors of your applications, so you can quickly fix issues. Visually explore log data to uncover trends over periods ranging from minutes to days, and reduce the time you need to understand the big picture. Once you’ve found something to investigate, you can deep dive into the details by clicking on the graph and inspecting the events that occurred at that time.
Sign up for a free plan- Python Syslog
- Aggregate, monitor, and analyze all your logs in one place. Send your Python logs using the SysLogHandler. Looking to expand your options? Try the SolarWinds syslog management tool