Real-Time MySQL Log Analysis
-
Trim large log files with filters
Find the information you need with powerful search queries and filters and ignore everything else. -
Use alerts to catch issues
With automatic alerts and notifications, you can detect issues and potential problems before your users do. -
View log messages as they’re received
Use live tail to see a live stream of events and understand how your MySQL server runs in production.

Here's How Papertrail Helps

Trim large log files with filters
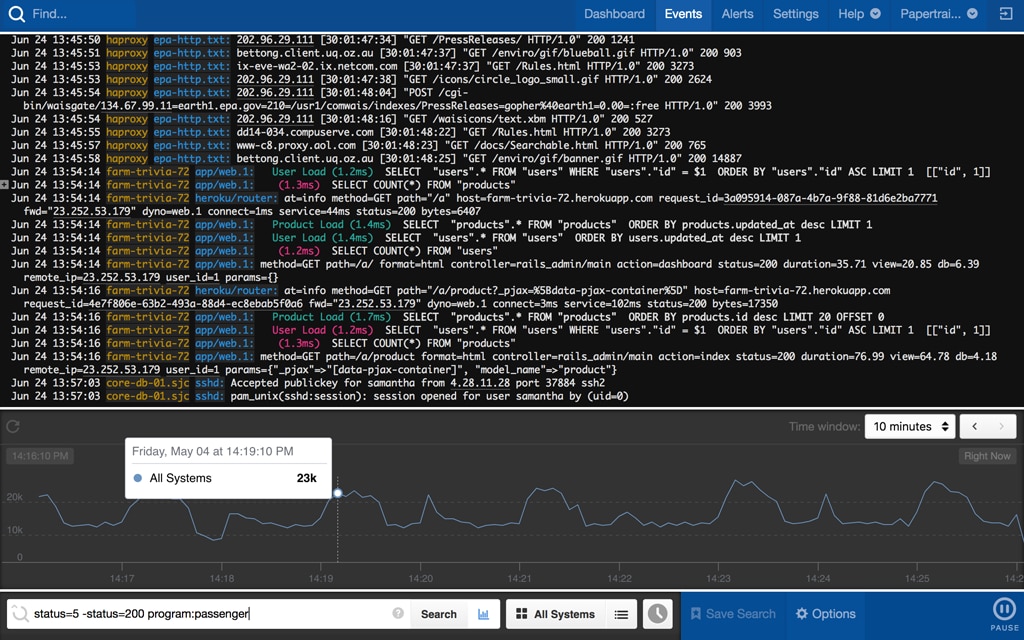
MySQL servers running in production can generate huge log files. SolarWinds® Papertrail™ offers a way to trim those volumes down to size using searching and filtering. The simple search syntax helps you to find the information you need in a sea of MySQL log data. With search attributes, you can locate log messages containing values in specific message fields. And you can further refine your search using filters to focus on the parts you need and ignore the pieces you don’t. Filter based on time, origin, or custom fields. If you need even more control to trim down the number of search results, you can use regular expressions to match any log format. Papertrail’s Event Viewer supports color highlighting, so you can be sure you’ll never miss important events. Contextual searching also allows you to find related log messages to reduce troubleshooting time.
Sign up for a free plan
Use alerts to catch issues
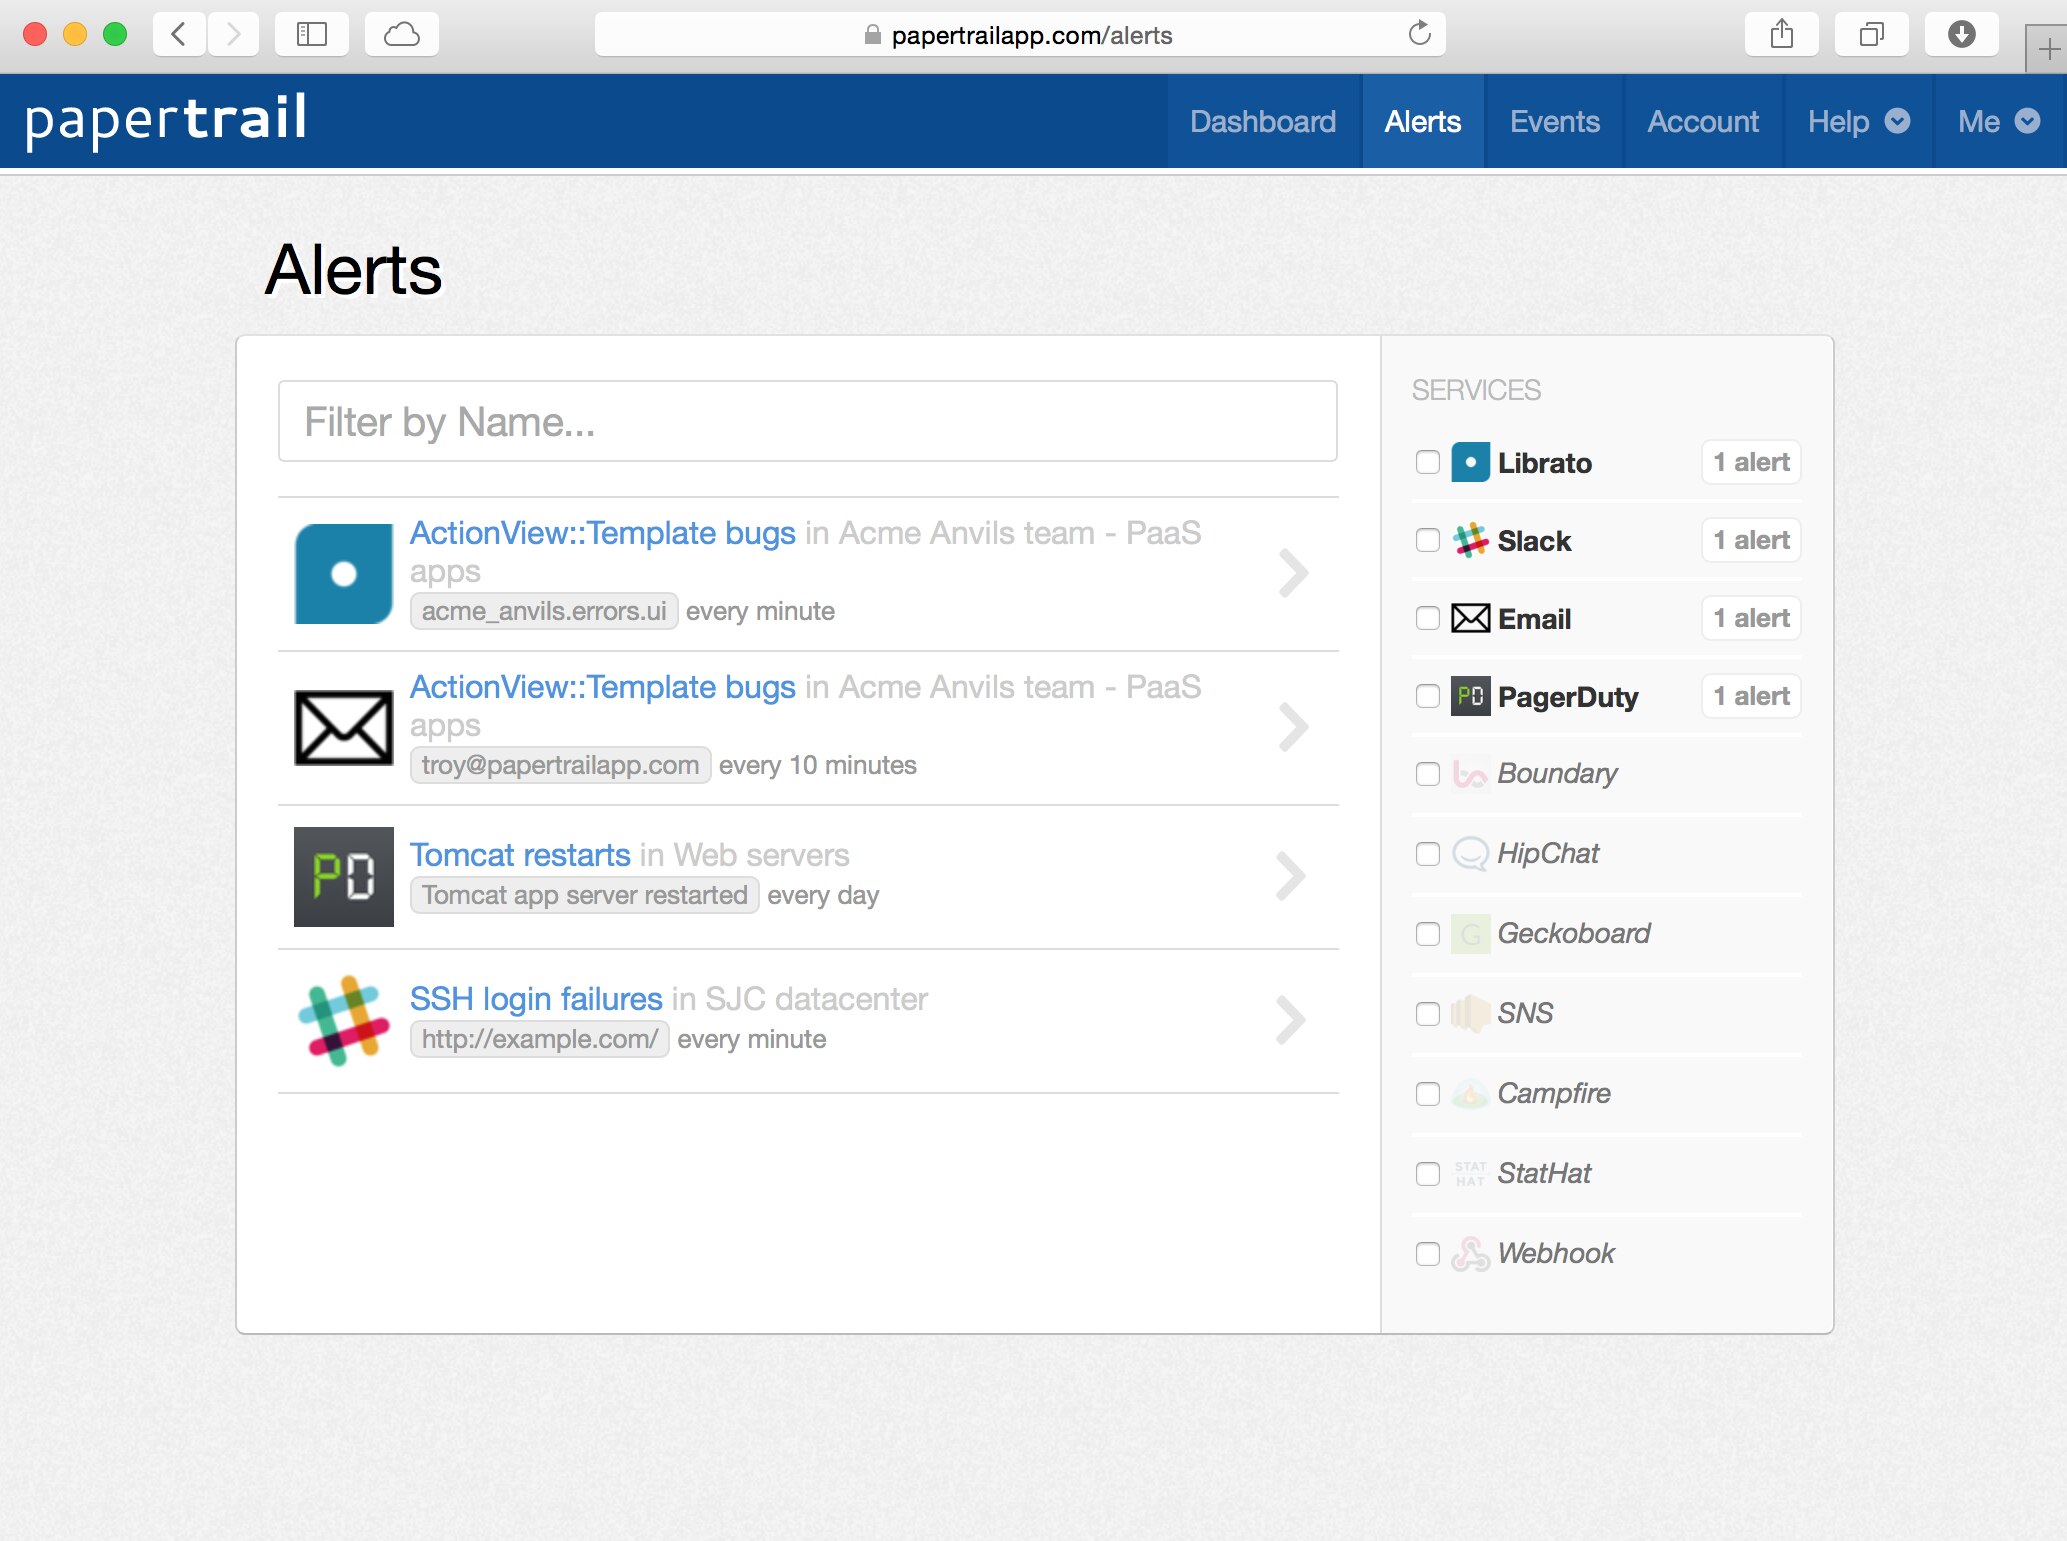
Quickly turn searches into alerts by saving them and assigning a schedule. You can run alerts every minute, hour, or day, so no matter whether you’re monitoring rapidly-changing metrics such as the number of database transactions, or slower-moving metrics like the number of database users per day, you can use alerts to catch minor issues before they become major catastrophes. If you need to know when an expected event doesn’t occur, such as when a cron job fails, you can send a notification using Inactivity alerts. Receive notifications over email or via third-party collaboration tools such as Slack, PagerDuty, or Campfire. And if you’re running your own custom monitoring tools, Papertrail supports using custom HTTP webhooks to notify you when alerts trigger. Set a minimum threshold to control how many events need to be seen before an alert fires.
Sign up for a free plan
View log messages as they’re received
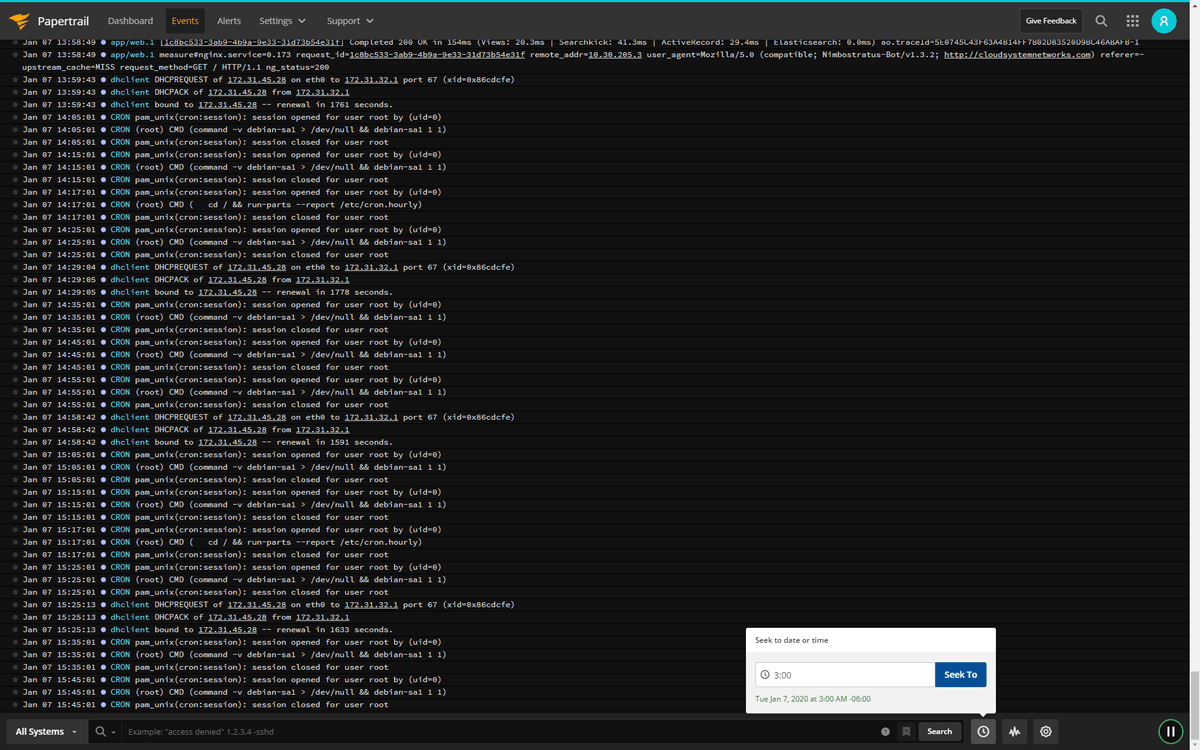
Use the Papertrail live tail feature to view MySQL log messages in the Event Viewer as soon as they’re received. This way, you can gain instant visibility into the health and behavior of your MySQL servers in real time. Customize the Event Viewer to highlight high-severity messages, and use contextual search to trace the cause of a problem back to the source. Contextual search is a handy feature for finding related MySQL log messages and piecing together which of them were generated by a single user transaction. You can pipe and redirect live tail output onto the command-line using the Papertrail CLI. Display command-line output with color highlighting to spot issues rapidly.
Sign up for a free plan- MySQL Logging
- Aggregate, monitor, and analyze all your logs in one place. Get the most out of your MySQL logs with cloud-based log management software.Still searching? You may be interested in the SolarWinds mysql reporting solution