Monitor your clusters with cloud-based Kubernetes log management
-
Aggregate your logs
Keep all your logs in one place and analyze logs from all your containers at the same time. -
Monitor your logs in real time
Get quick insights from Docker logs with live tail and interactive search features. -
Troubleshoot faster
Reduce time to troubleshoot errors and spot recurring patterns in your logs with log velocity analytics.

Here's How Papertrail Helps

Aggregate your logs
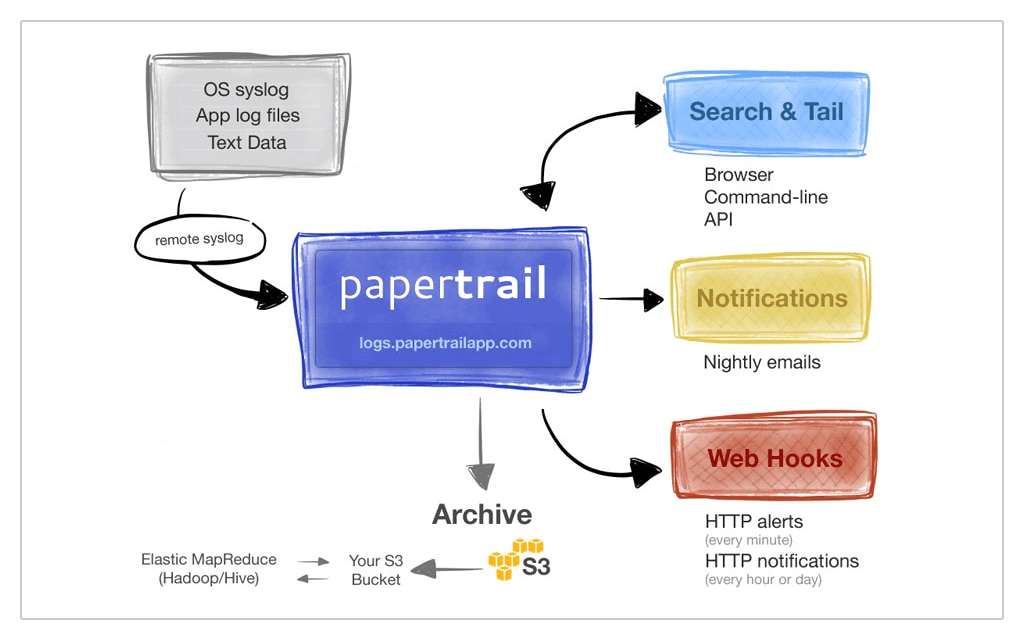
Store all of your Docker logs in one place with Kubernetes log aggregation and avoid hunting through individual container logs when troubleshooting. Search through every log message from your Kubernetes cluster with a single interface. Route logs from your containers to SolarWinds® Papertrail™ with logspout, or catch all Kubernetes and Docker logs and forward them with Fluentd. Use DaemonSets with logspout or Fluentd for improved resilience and to ensure your logs are always stored in a central location with Papertrail. You can even configure application-level logging to directly send logs to Papertrail using the syslog protocol.
Sign up for a free plan
Monitor your logs in real time
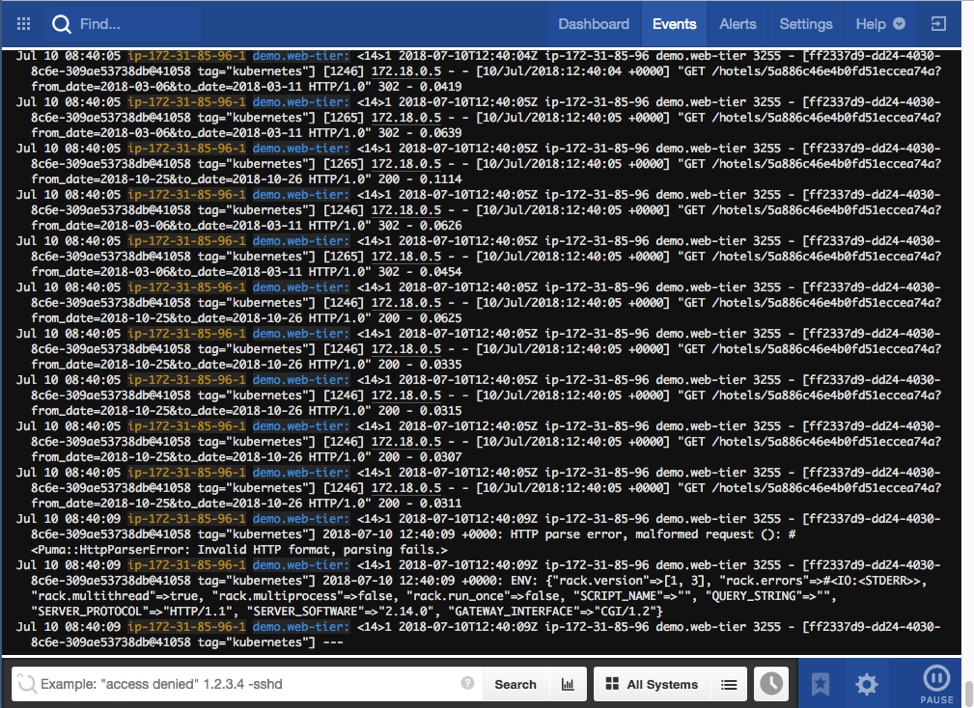
Keep your finger on the pulse of your clusters with the Papertrail live tail feature. Watch incomings logs as they’re received and use regular expressions to search and filter events in real time. Just like the docker logs --follow command, live tail lets you view a stream of new output from your containers. Pause, search, and scroll through the live feed and click on log elements like IP address, UUID, and user IDs to drill down into low-level details. Highlight critical events with colorized log messages and a customizable event viewer, and use contextual searching to trace issues back to their source.
Sign up for a free plan
Troubleshoot faster
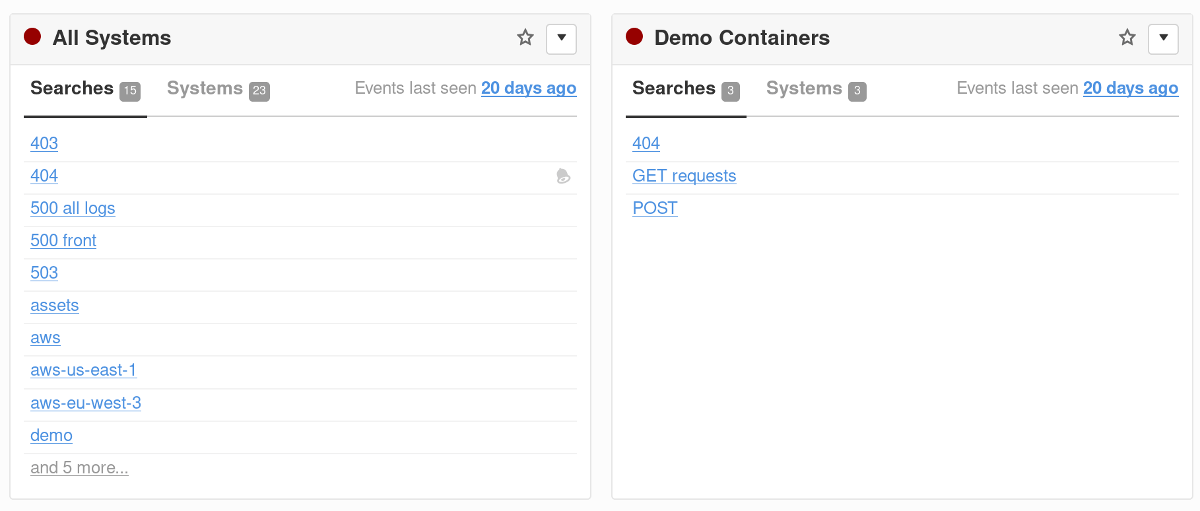
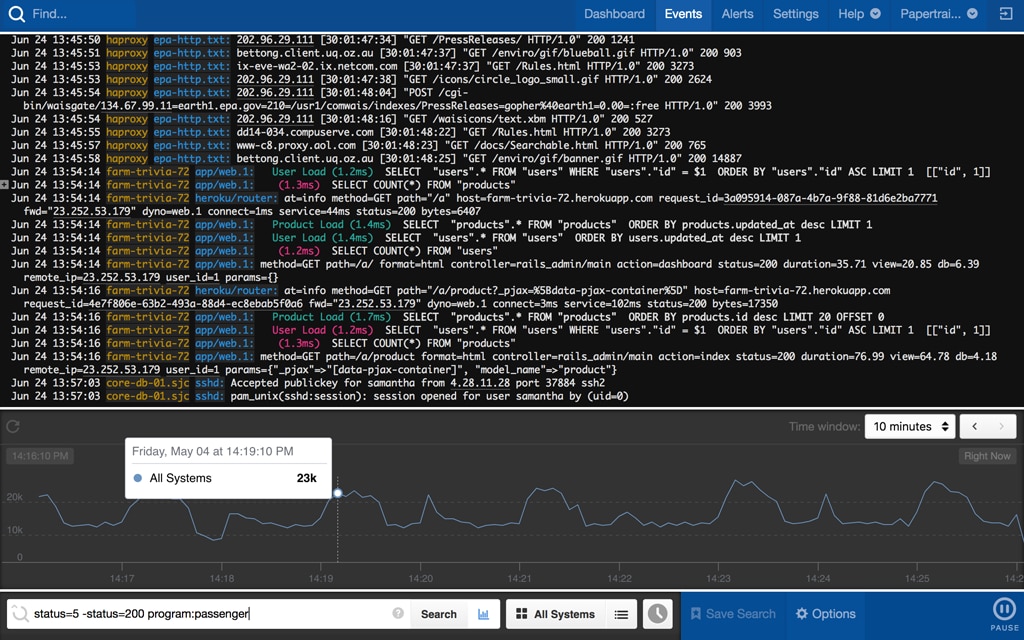
Visualize log events and uncover insights in your log data with log velocity analytics. Use saved searches, or create new ones, to focus on log data covering the period you’re most interested in and build interactive graphs to help you identify patterns and anomalies. Quickly troubleshoot issues, such as traffic spikes or increasing error rates, by clicking on the visualization and jumping straight to the underlying log messages. You can diagnose problems from the last ten minutes or spot trends occurring over the last two weeks, and greatly reduce the time to find issues by visually exploring your log data.
Sign up for a free plan- Kubernetes Logging
- Aggregate, monitor, and analyze all your logs in one place. Get the most out of your Kubernetes logs with our cloud-based Kubernetes logging solution.