Speed Up JavaScript Log Analysis
-
Aggregate and analyze your logs
Consolidate your logs in one place to make infrastructure-wide analysis possible. -
Trim log volume with searching and filtering
Use powerful searching and filtering capabilities to reduce log volume when troubleshooting. -
Catch trends early with visualizations
Detect trends sooner by turning your logs into an interactive visualization to help you navigate through your log data.

Here's How Papertrail Helps

Aggregate and analyze all your logs
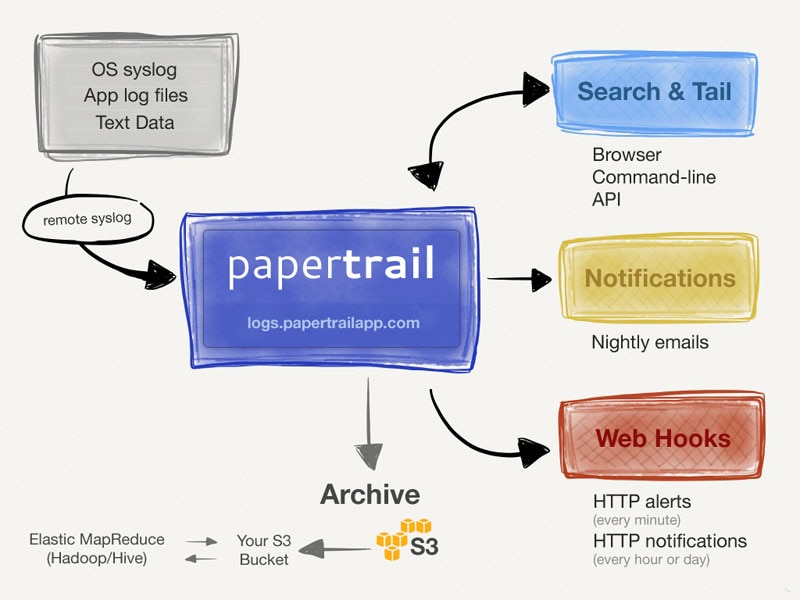
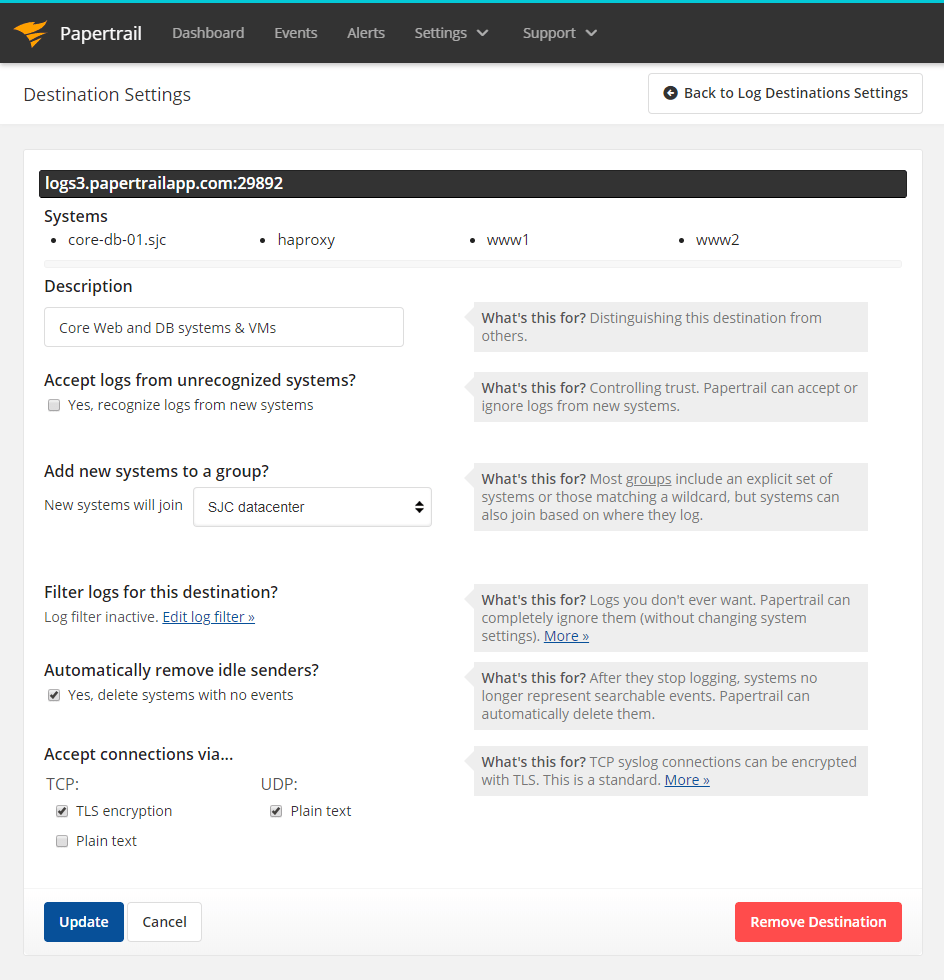
Aggregate logs from your apps and services into a single location and make it possible to perform infrastructure-wide analysis from a single interface. The intuitive UI in SolarWinds® Papertrail™ helps you to search through your log data no matter which software component created it. Even if you’re working with huge volumes of data, searching is quick because all logs are stored in the cloud. Many JavaScript libraries and frameworks are available for sending log messages to Papertrail using the syslog protocol. You can even use the Papertrail standalone remote_syslog2 daemon to monitor text files and forward new log entries. Send log messages over UDP or TCP with TLS encryption for improved security. Papertrail allows you to configure access control for your logs, so you can grant individual team members full or read-only access to log files and control which users can purge logs.
Sign up for a free plan
Trim log volume with searching and filtering
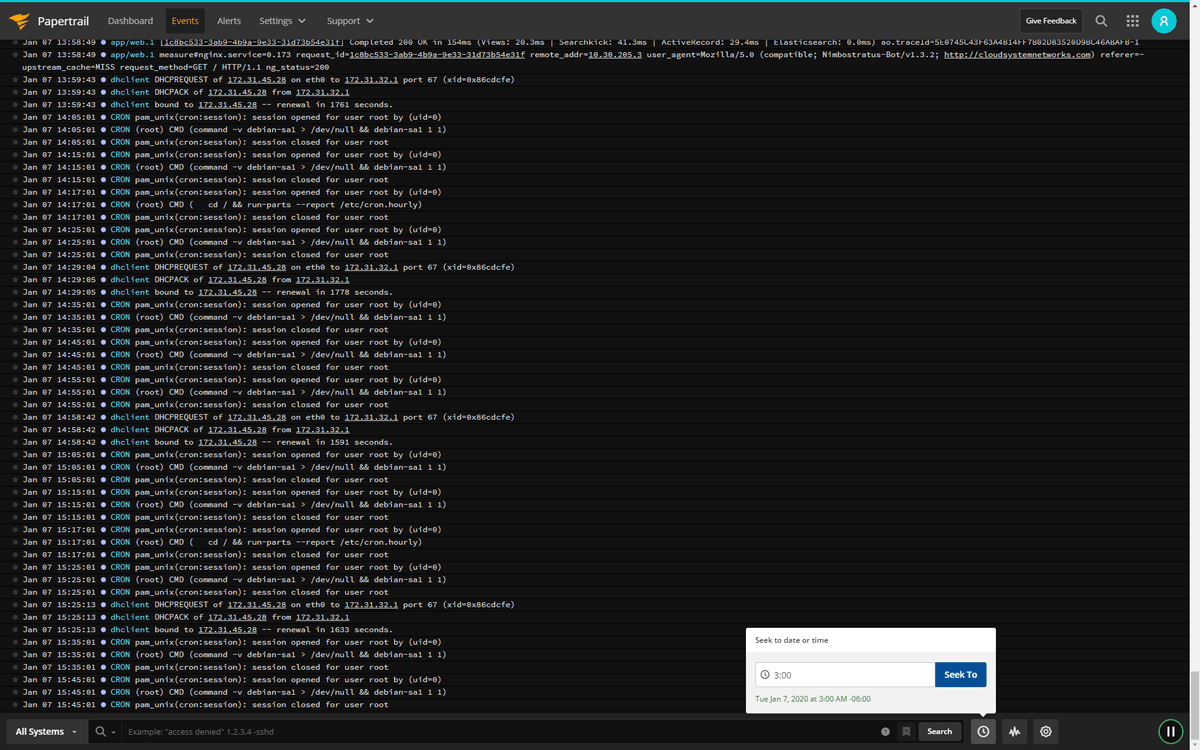
Finding the information you need when troubleshooting can be time consuming if you’re working with huge log volumes. The simple search syntax in Papertrail helps you locate only the log messages you need and discard the ones you don’t. You can further refine search results using filters. Filter your logs based on time, origin, or custom fields such as session ID. The live tail feature lets you view incoming logs in real time and apply filters to events as they’re received. Scroll through new and old events in the event viewer to gain instant visibility into your systems and identify issues faster. With the Papertrail CLI tool, you can pipe and redirect the live tail output onto the command line using colors to highlight severity levels.
Sign up for a free plan
Catch trends early with visualizations
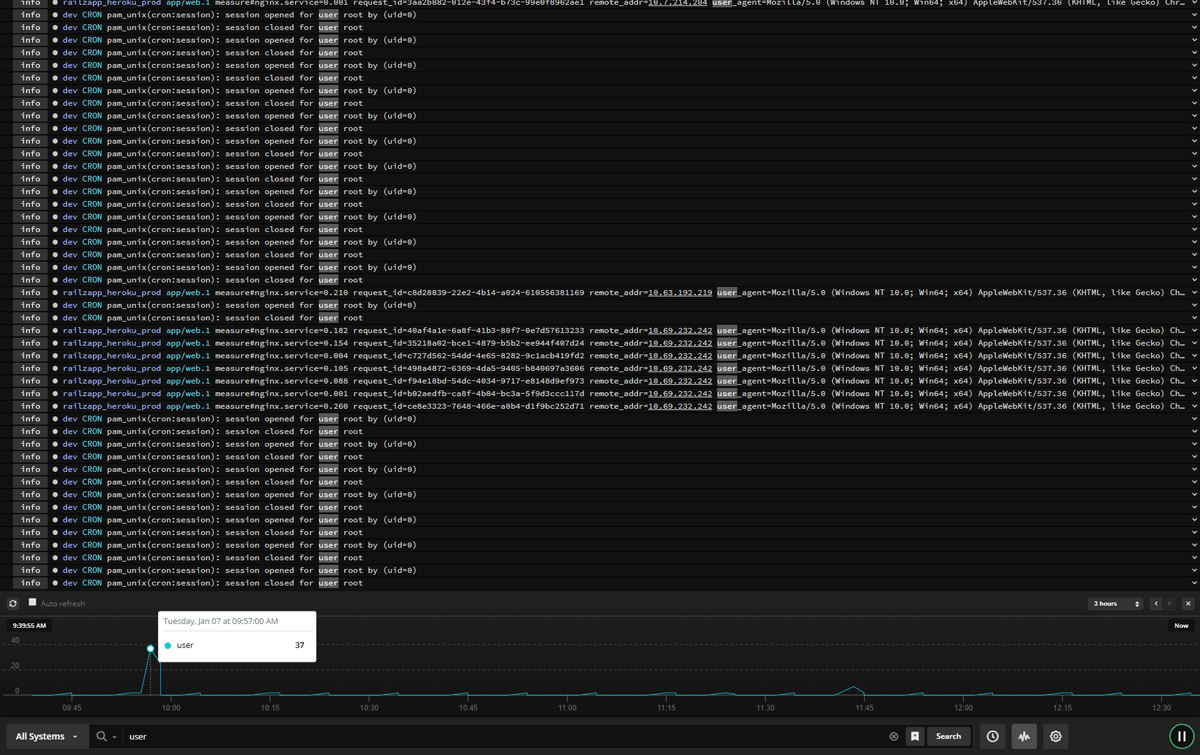
Your log files contain a wealth of information. Turn data into an interactive visualization to uncover insights and detect problems before they develop into major incidents. Use log velocity analytics to view a high-level picture of your historical log data and dive into the low-level event details with typically two clicks. Visualizations make it easy to identify latency spikes over the last two weeks. To learn about problems as soon as they happen, you can save your search and quickly create an alert. Schedule alerts to run every minute, hour, or day and send notifications via email or third-party collaboration tools such as Slack, PagerDuty, and Campfire. You can also send notifications using custom HTTP webhooks, which integrate seamlessly into your custom monitoring tools. If you want to know when an expected event doesn’t occur, you can use inactivity alerts to catch things like failed backups and cron jobs that never ran.
Sign up for a free plan- Javascript Logging
- Aggregate, monitor, and analyze all your logs in one place. Get the most out of your Javascript logs with cloud-based log management software.