Centralized view across IIS Log
-
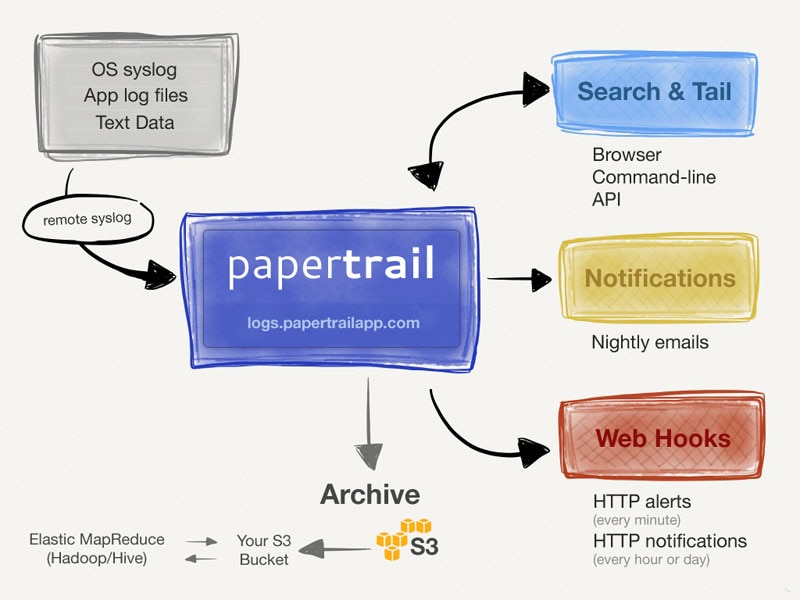
Aggregate logs for easy access
Centralize logs from your IIS instances and the systems, services, and devices your web applications rely on into a single view -
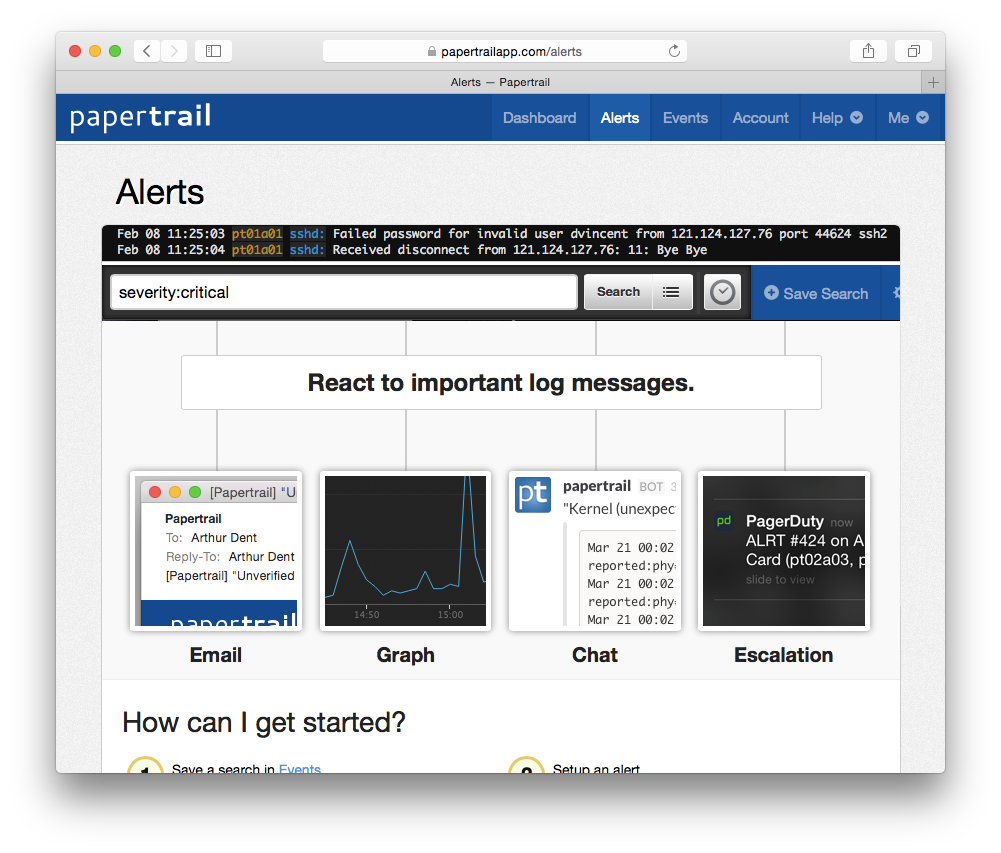
Monitor and alert in real time
Parse and scan event messages as they arrive and generate real-time alerts to identify potential issues before users are impacted -
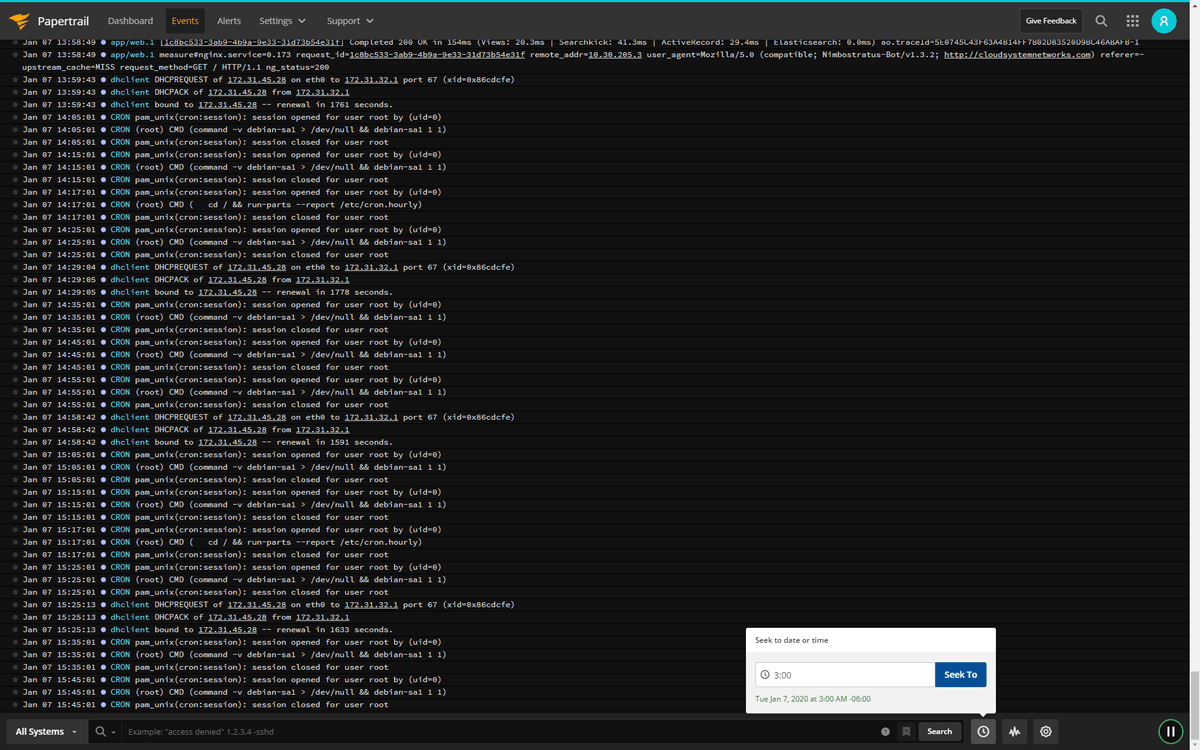
Accelerate troubleshooting
Tail and search events from multiple sources in real time to quickly identify issues and pinpoint the cause

Here's How Papertrail Helps

Aggregate logs for easy access
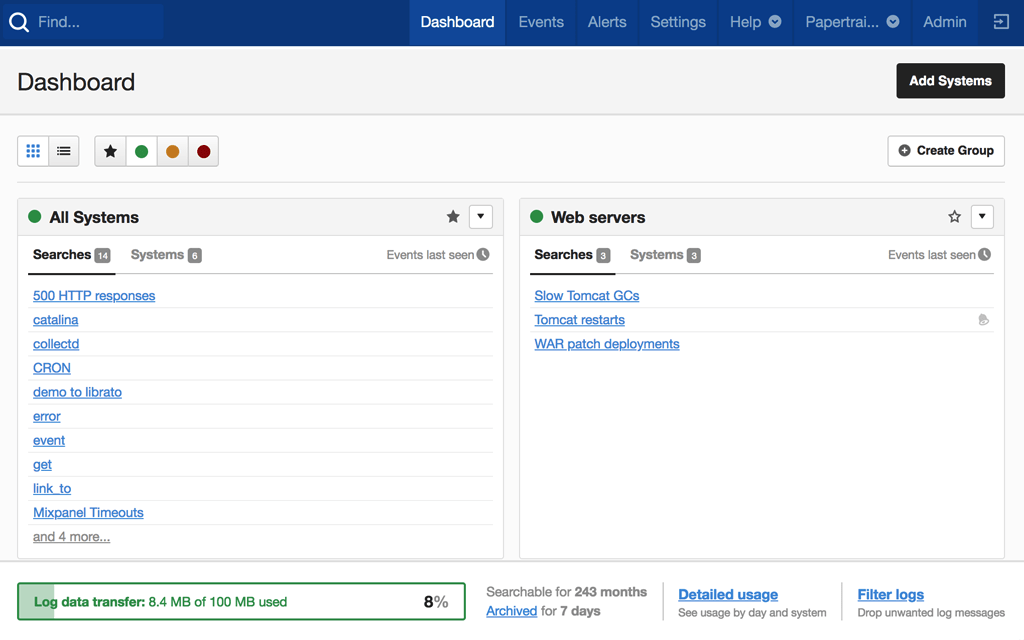
Centralizing all of your IIS and infrastructure logs into a single location helps you to understand the big picture and easily analyze your entire software stack. By aggregating all of your logs from every server, device, and service, you can gain instant visibility into every part of your app. With the web-based Papertrail™ event viewer, you can search and filter your logs to focus on the pieces you need. Your log data is stored in the cloud which means you can scale your storage capacity to meet demand and archive logs for long-term analysis. Papertrail lets you control global archive retention policies in one place and updating those policies is as simple as changing the configuration and saving the new settings. Tightly control who can access your logs by setting up access permissions for your logs to limit users to specific devices and files.
Sign up for a free plan
Monitor and alert in real time
Manually running searches on your logs simply doesn’t scale when you need to monitor your IIS web servers in real time. Fortunately, you can turn your saved searches into alerts by scheduling them to run every minute, hour, or day. The range of scheduling frequencies allows you to monitor everything from critical conditions (IIS web servers going offline) to daily summaries (requests served per day). Receive notifications via email when alerts trigger, or send notifications to your team’s chosen collaboration tool. Papertrail can send alert notifications to Slack, PagerDuty, Campfire, and more. If you’re running your own custom monitoring service, you can receive alert notifications via custom HTTP webhooks. Sometimes you need to know how frequently an event occurs. Log velocity analytics provides a way to create visualizations from your log data and uncover patterns and anomalies, making troubleshooting both easier and faster. This way, you can identity and fix problems before users notice.
Sign up for a free plan
Accelerate troubleshooting
Papertrail supports a simple search syntax which helps you to build queries designed to trim down large log volumes and pull out the most salient points to help with troubleshooting, and the live tail feature allows you to filter incoming messages as they’re received. Use regular expressions to build complex filters to limit tailed logs to specific devices or services and make real-time analysis easier. With the Papertrail CLI, you can tail logs from the command line and display the output with color highlighting or convert it to JSON for easy integration with other analysis tools. Use the log analyzer to navigate the chain of events when troubleshooting, and locate the root cause of problems faster by using context links to view infrastructure-wide history. Clickable elements such as IP addresses and UUIDs mean you can seamlessly navigate through your logs and investigate across devices and services.
Sign up for a free plan- IIS Log Viewer
- Aggregate, monitor, and analyze all your logs in one place. Get the most out of your IIS logs with cloud-based log management software.