Make monitoring and troubleshooting easy with a scalable Docker log server
-
Aggregate container logs in one place
Store all your Docker logs together and improve the visibility of your infrastructure. -
Analyze logs with searching and filtering
Discover issues and errors faster with powerful search features, and watch logs in real time with live tail. -
Proactively identify issues using alerts
Catch issues as soon as they happen with alerts and notifications, and spot trends with data visualization.

Here's How Papertrail Helps

Aggregate container logs
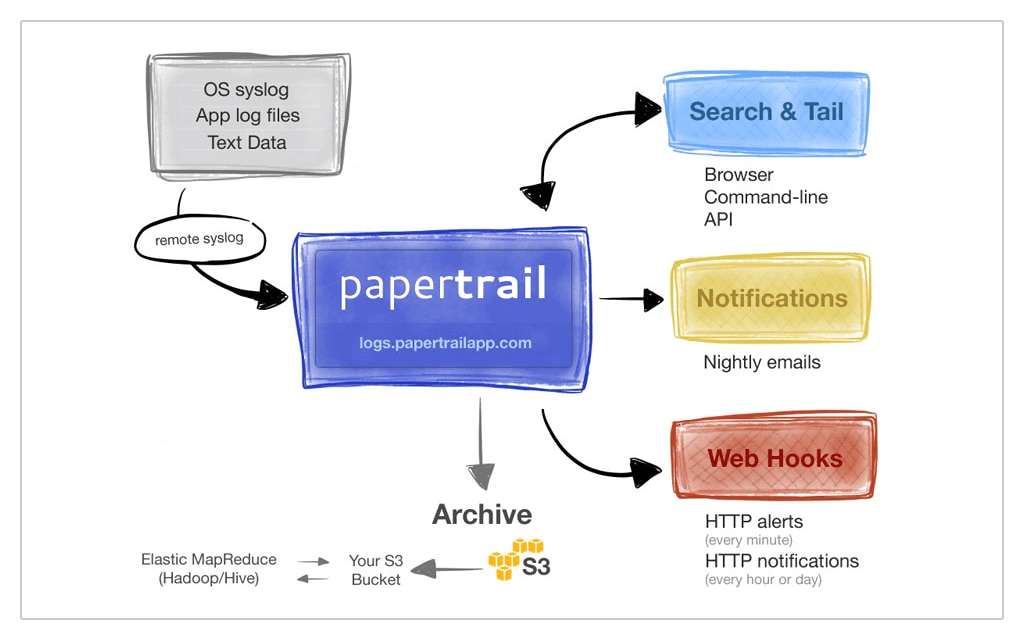
By storing all your Docker logs in a single location, you can build an infrastructure-wide view of your containers. Send logs directly to SolarWinds® Papertrail™ with the syslog logging driver, forward application text log files and system logs with the remote_syslog2 and rsyslog daemons, or use a logspout container to route logs to one of your Papertrail log destinations. Transmit logs over UDP or TCP with TLS encryption for better security and protection. Use Docker log tags to annotate container logs before they reach Papertrail and make them easier to analyze when performing investigations and troubleshooting.
Sign up for a free plan
Analyze logs with searching and filtering
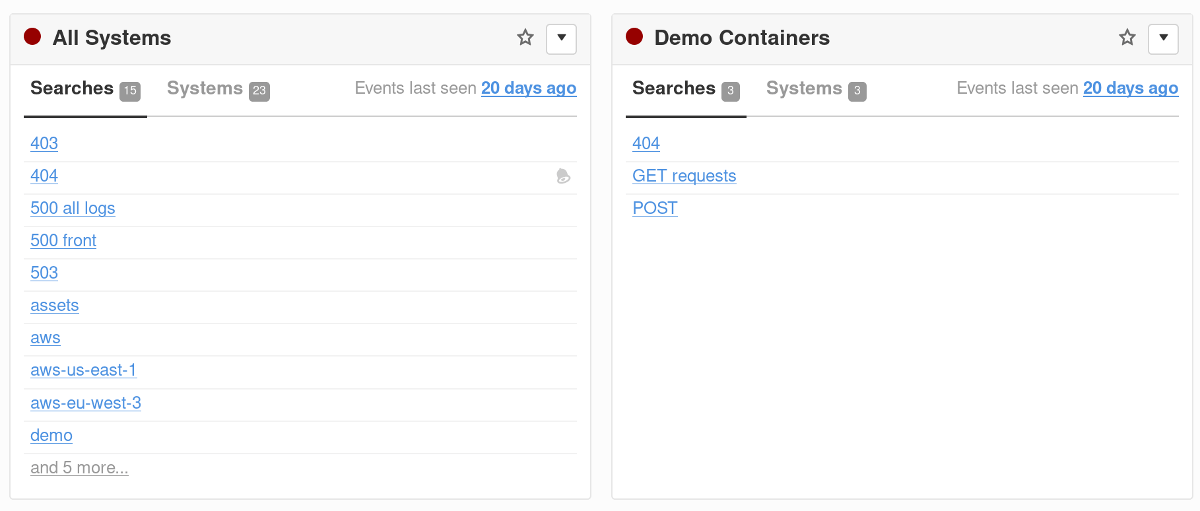
Tame container logs of any size with advanced searching and filtering features. The simple search syntax in Papertrail lets you effortlessly search through your Docker logs and trim them down to size, so you can focus on just the parts you need when troubleshooting. Cut through the noise with exclusion searches and use powerful regular expressions to further refine and filter log data. Watch incoming log messages with live tail and see events in real time just like docker logs --follow. Live tail’s pause, search, and infinite scroll capabilities let you search both old and new log messages from a single interface.
Sign up for a free plan
Identify issues with alerts
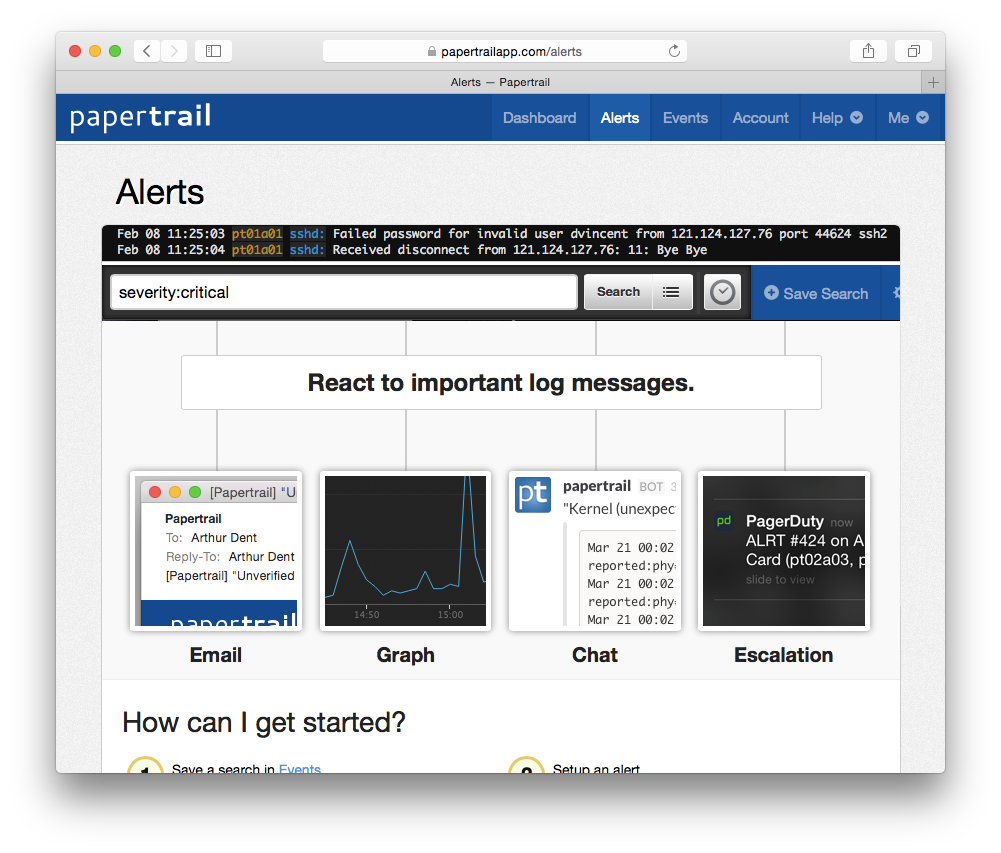
Save your most important search queries and run them automatically every minute, hour, or day by creating alerts that detect issues immediately when they happen. Receive alert notifications via email or your favorite communication tool, such as Slack, PagerDuty, or Campfire. You can even send notifications via custom HTTP webhooks and integrate them into your existing tools. Visually explore your log data using log velocity analytics, and plot events over time to spot trends and patterns. Create graphs of log data from the last hour to identify traffic spikes and use data over longer periods to detect recurring anomalies.
Sign up for a free plan- Docker Syslog
- Aggregate and monitor your container logs in one place with a cloud-based Docker log server.