A robust centralized log management tool
-
Centralize your logs
Consolidate your logs in a single location to get a holistic view of your systems. -
Simplify log management
Create and enforce log retention and access policies. -
Receive real time alerts
Receive real time notifications to catch issues before they impact your users.

Here's How Papertrail Helps

Centralize your logs
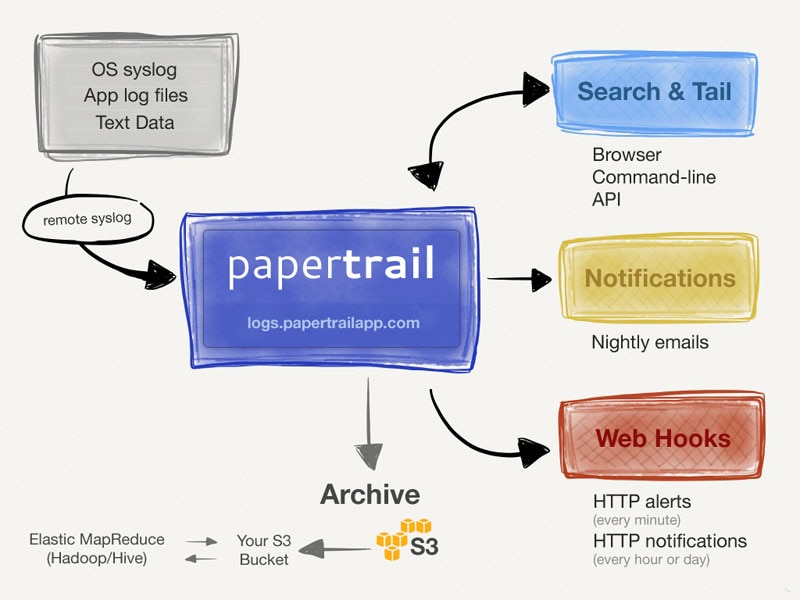
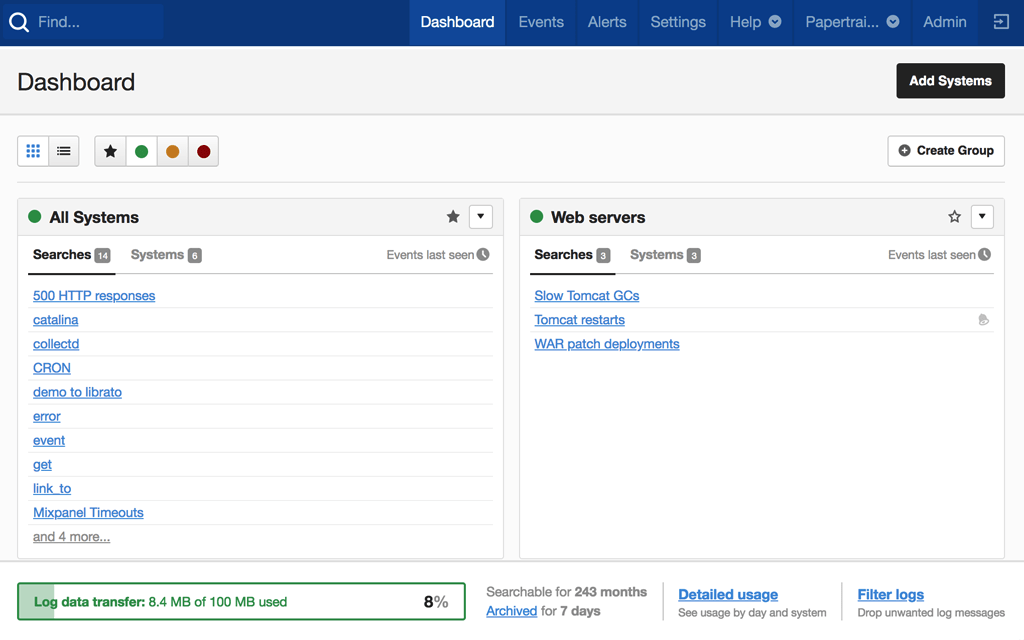
Searching through logs stored on multiple servers can add significant delays when analyzing problems. Consolidating your logs into one place makes it much faster to diagnose and resolve issues, no matter where they appear in your infrastructure. By using a central interface to access all your data at once, you can understand the bigger trends and spot patterns in your data. Whether you’re running one server or application or a thousand, consolidating your logs with SolarWinds® Papertrail™ lets you quickly search through log data to find the messages you need when you need them using a simple search syntax. Automatically back up your log data and archive it for later retrieval. You can configure archives to be retained for a specific period or forever, allowing you to customize how your log data is stored, so you can implement your retention policies.
Sign up for a free plan
Simplify log management
Aggregating your log data with Papertrail allows you to easily manage your log data. Papertrail allows you to control global retention policies with an intuitive UI. If your retention policies ever change, updating them is as simple as changing the period in the Papertrail configuration settings and clicking save. With your logs in one place, it’s easy to configure access control for users on your team. Assign read-only or full access permissions to users and grant the ability to purge log files to only those team members that need it. And because your logs are stored in an Amazon S3 bucket, your log data benefits from high-availability and resiliency.
Sign up for a free plan
Generate alerts based on log metrics
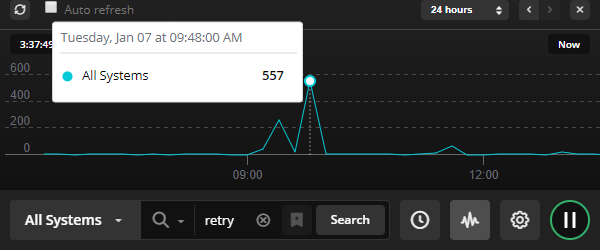
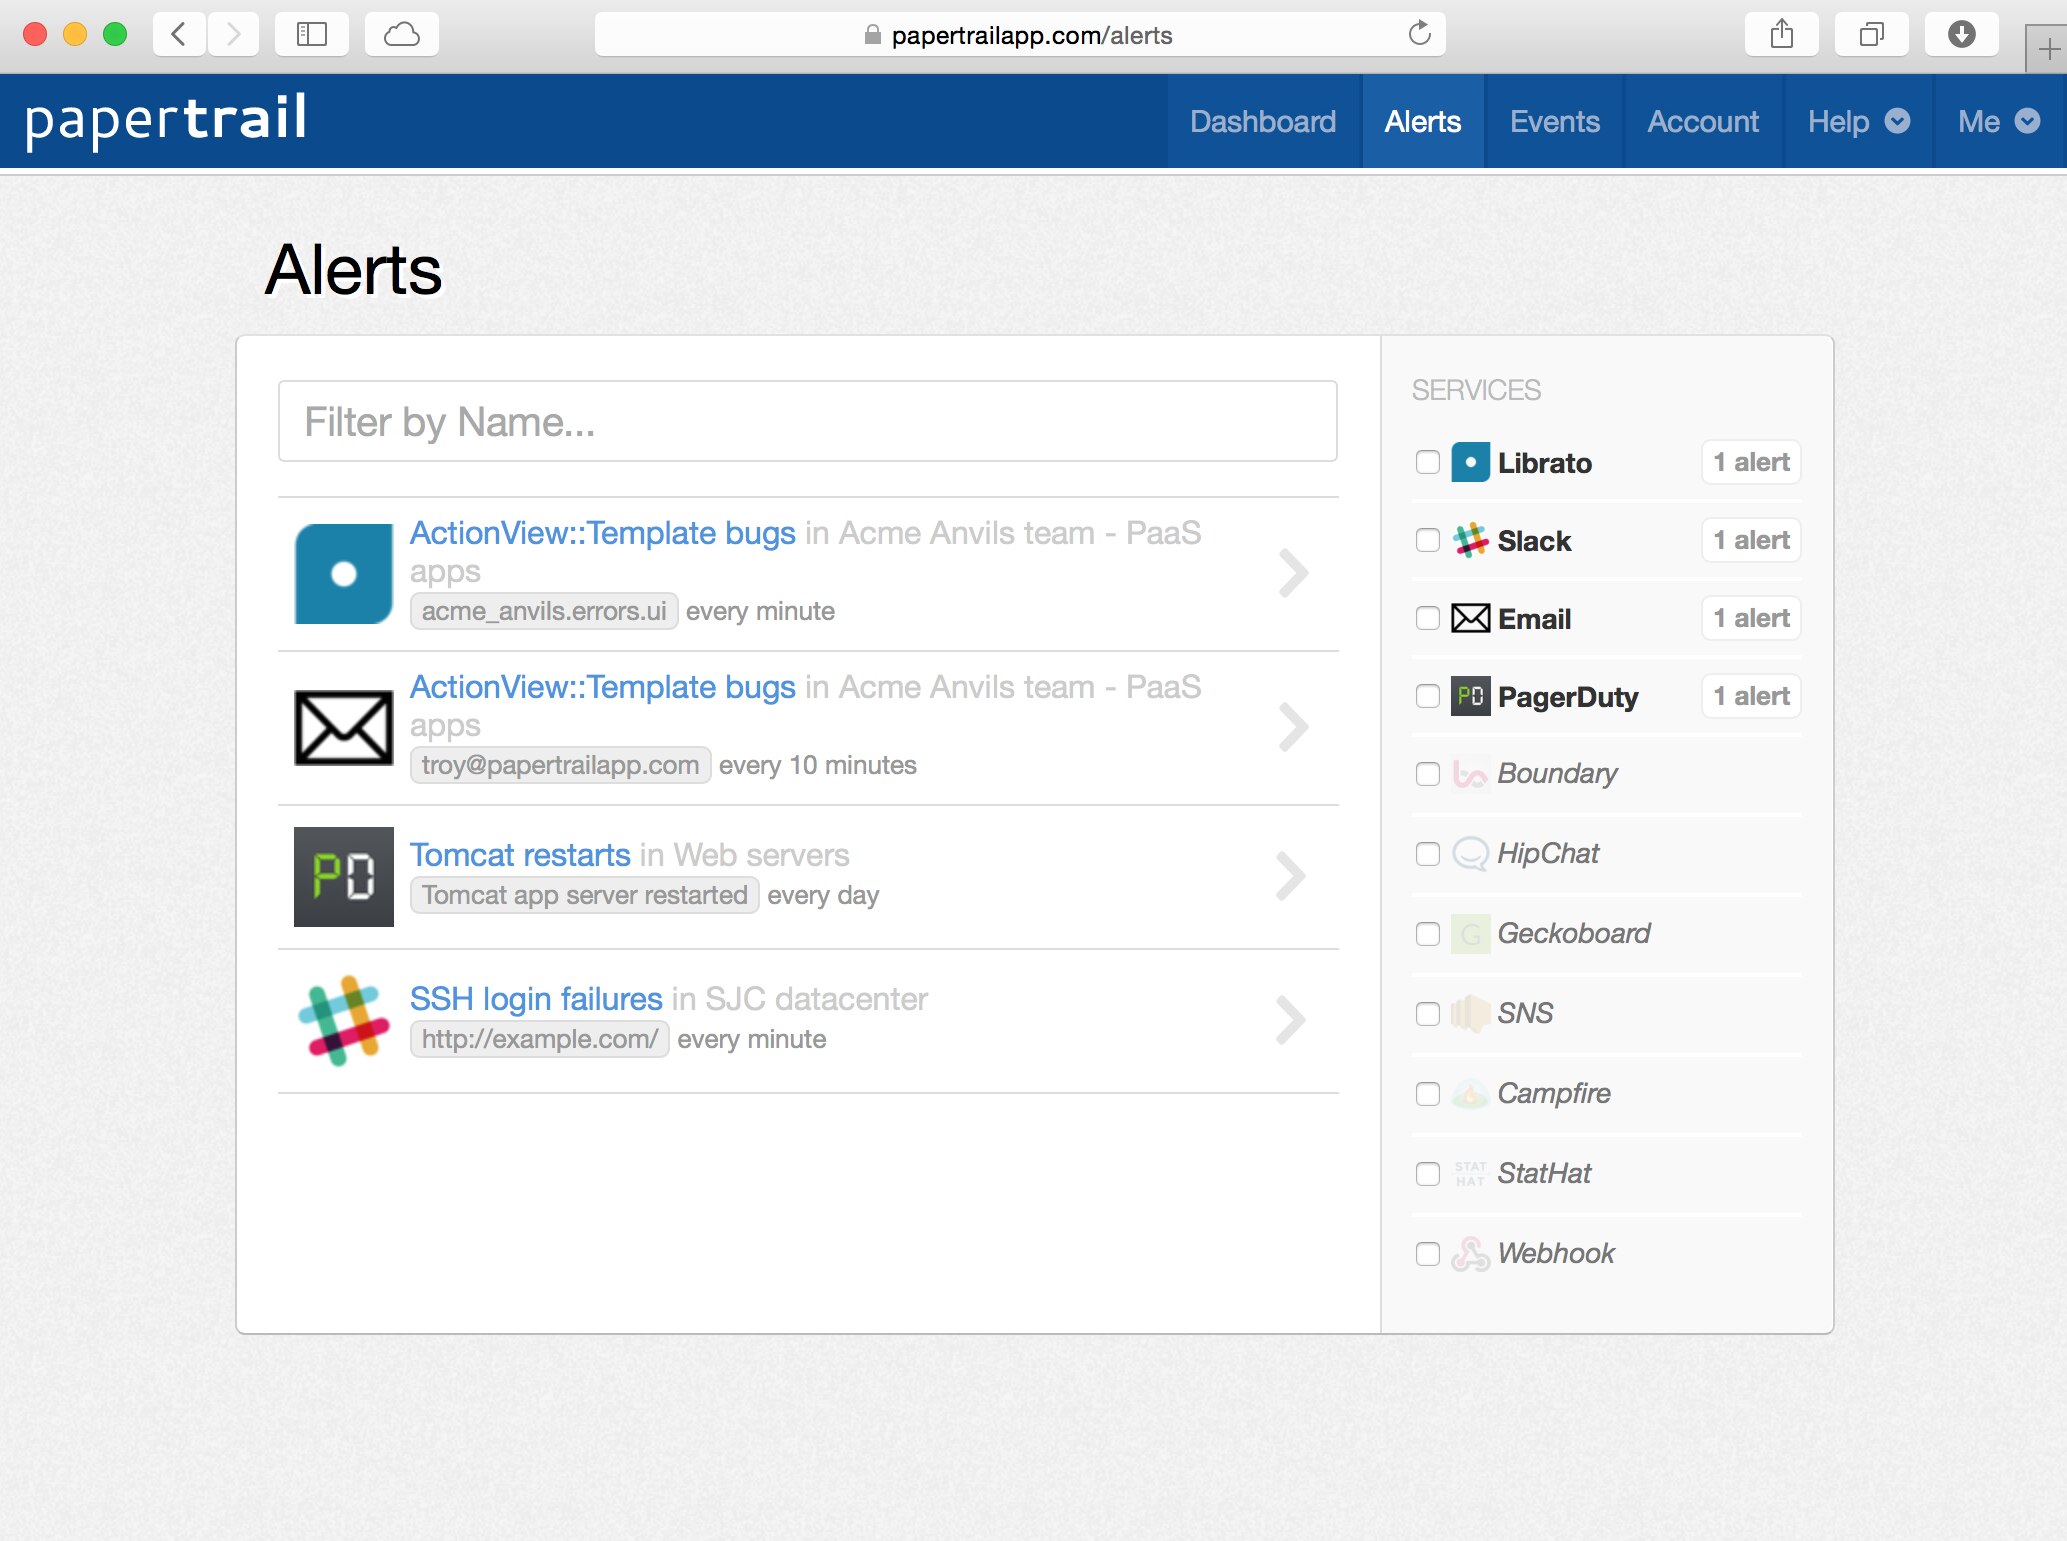
Monitoring your Apache servers by manually running searches makes it easy to miss problems and it simply doesn’t scale. Turn your most frequent searches into alerts and catch issues before they affect your users. You can schedule your alerts to run every minute, hour, or day. Using inactivity alerts, you can discover when an expected event didn’t occur, which can be useful for making sure your Apache servers are processing requests correctly. When an alert triggers, you can receive notifications by email or by using your team’s choice of collaboration tool, like Slack, PagerDuty, and Campfire. You can even send alert notifications to custom HTTP endpoints. Sometimes the best way to identify problems is by visualizing your data, and log velocity analytics help you understand how often events occur and spot patterns and anomalies in your log data, making it perfect for troubleshooting traffic spikes from the last 10 minutes, or spot trends over the last two weeks.
Sign up for a free plan- Centralized Log Management
- Aggregate, monitor, and analyze all your logs in one place. Get the most out of your logs with cloud-based log management software. On the hunt for more? Don’t forget to visit the SolarWinds Centralized Log Management