Make AWS log management simple with Papertrail
-
Centralize all your logs
Store all your logs in one place, whether they’re on AWS or a private cloud. -
Speed up analysis
Use everyday regular expressions to search, filter, and drill down into your log data. -
Discover trends and patterns in your log data
Reduce time to troubleshoot errors and uncover trends with log velocity analytics.

Here's How Papertrail Helps

Centralize all your logs
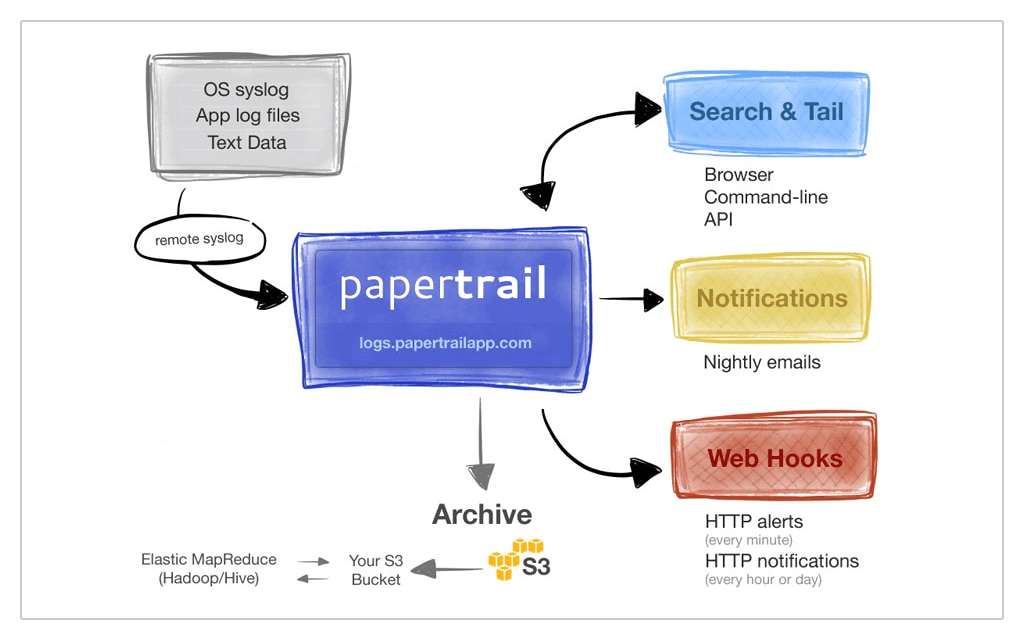
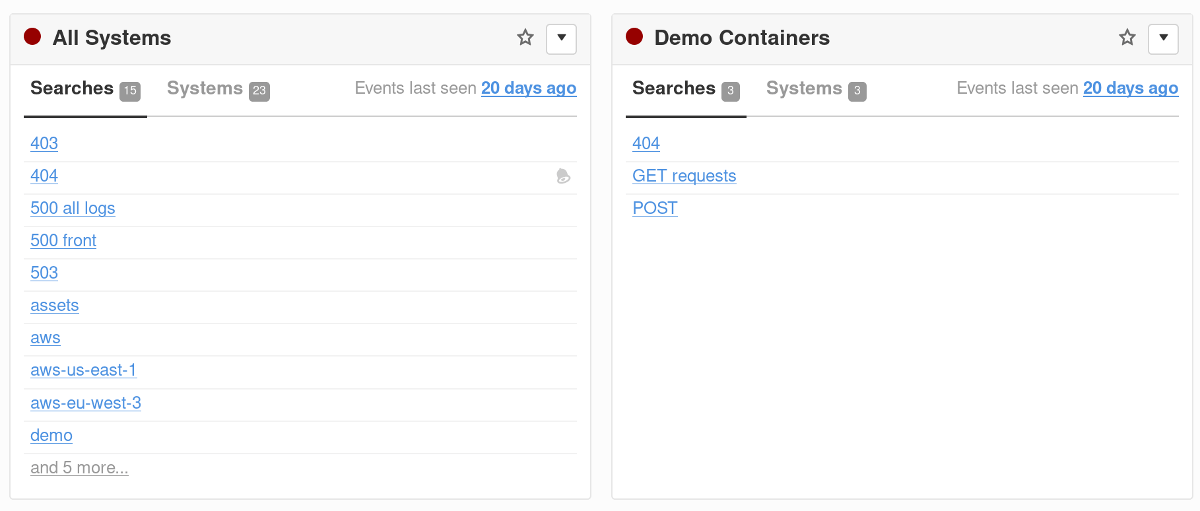
Send all your log files to SolarWinds® Papertrail™ and store them together in a central location. Don’t worry if you’re running across public and private clouds—everything can be stored with Papertrail. Use the central interface to view all log messages simultaneously and map infrastructure-wide history. Forward log messages you’ve aggregated in CloudWatch Logs to Papertrail with Amazon Lambda functions, or use a logspout container to route messages to the Papertrail syslog endpoint. Group logs from related senders together to make analysis faster and better understand which groups of services are affected by issues and trends.
Sign up for a free plan
Speed up analysis
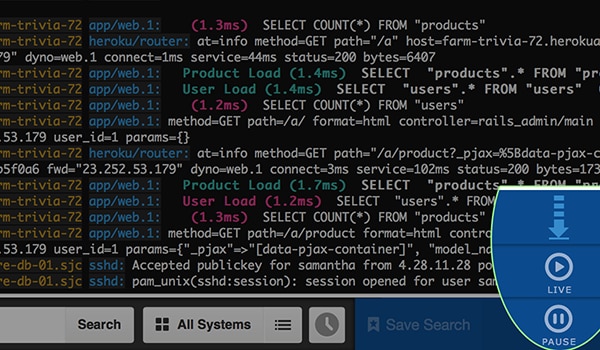
Search through your log messages as they’re received with the Papertrail live tail feature and gain instant visibility into your AWS services. Use regular expressions to filter out unwanted items and home in on important log messages when diagnosing and troubleshooting. Context links between messages let you navigate through your data using clickable log elements such as sender, time, IP addresses, user IDs, and more. Trace user transactions across multiple log messages to analyze user behavior holistically. Turn your most useful searches into alerts and receive notifications whenever they’re triggered by incoming log messages.
Sign up for a free plan
Discover trends and patterns in your log data
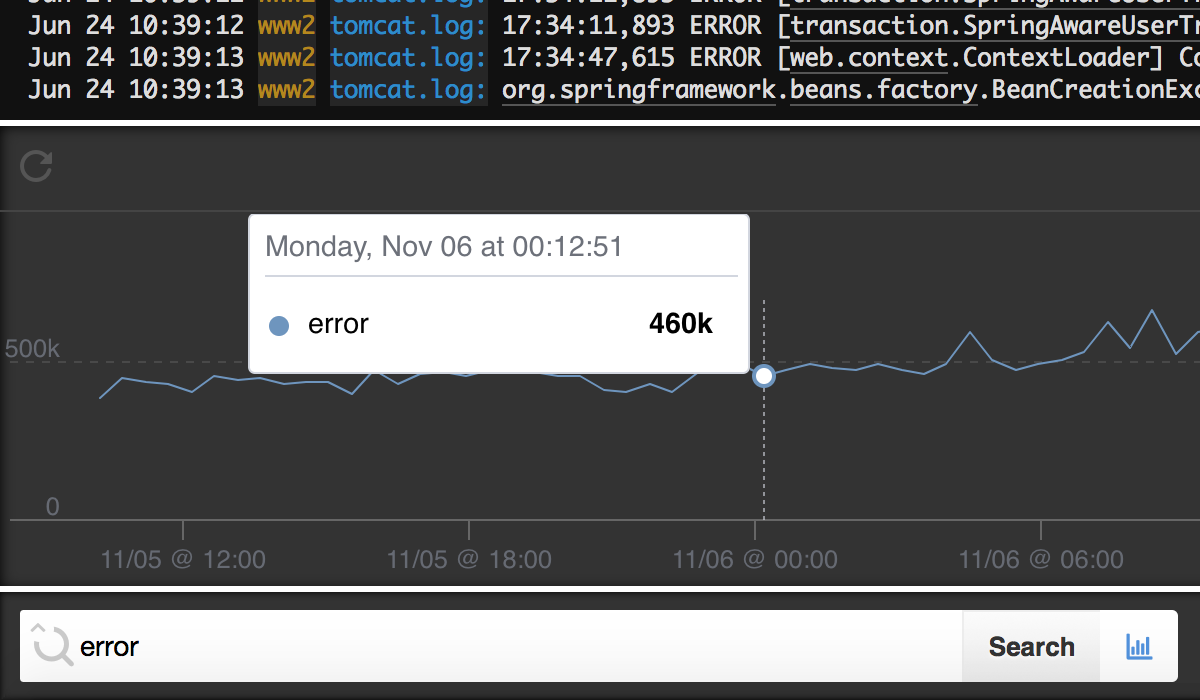
With log velocity analytics, you can turn your search queries into interactive graphs to visually explore your logs. Use data visualization to uncover trends and identify anomalies in your AWS log data by plotting log items over a specified period. Diagnose traffic spikes from the last ten minutes and spot issues from the last two weeks. After you’ve found something worth investigating, you can dig deeper by clicking on the graph and navigating directly to the log messages. The combination of high-level view and low-level details reduces the time needed to understand the data in your logs.
Sign up for a free plan- AWS Logging
- Aggregate, monitor, and analyze all your logs in one place. Get the most out of your AWS logs with a cloud-based AWS logging service. Still searching? You may be interested in the SolarWinds AWS Monitoring