Real Time Application Log Management
-
Aggregate application and host logs
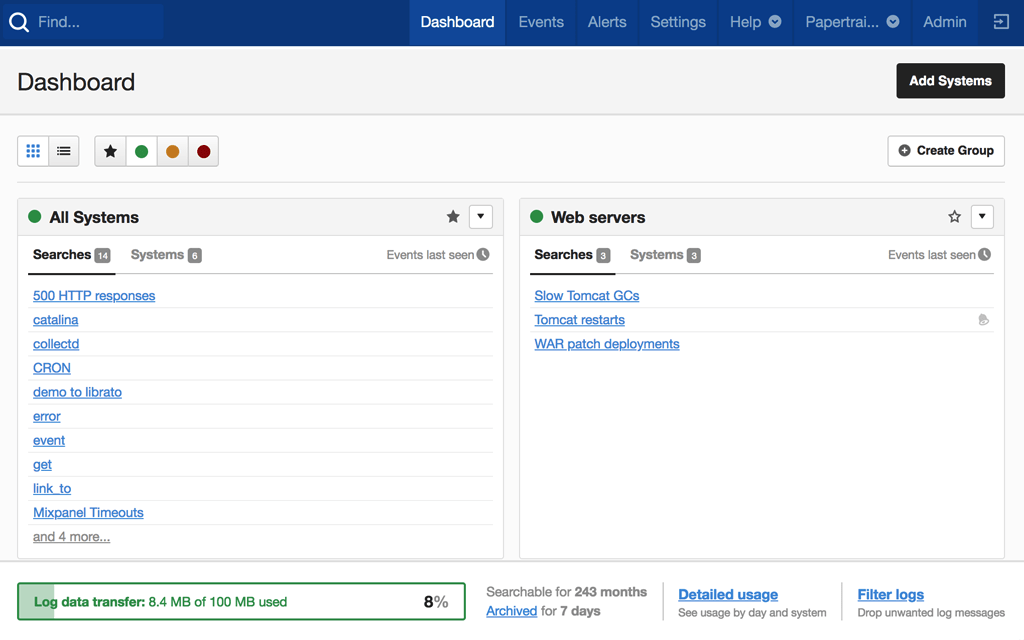
Aggregate the logs from all the systems, services, and devices your application depends on into a central location, for easy access and faster troubleshooting. -
Troubleshoot faster
Tail and search events from multiple sources at the same time to quickly pinpoint bottlenecks and find the root cause. -
Proactively monitor with real time alerts
Scan incoming logs in real time to spot issues early and receive instant alerts to catch issues before there’s a service impact.

Here's How Papertrail Helps

Aggregate application and host logs
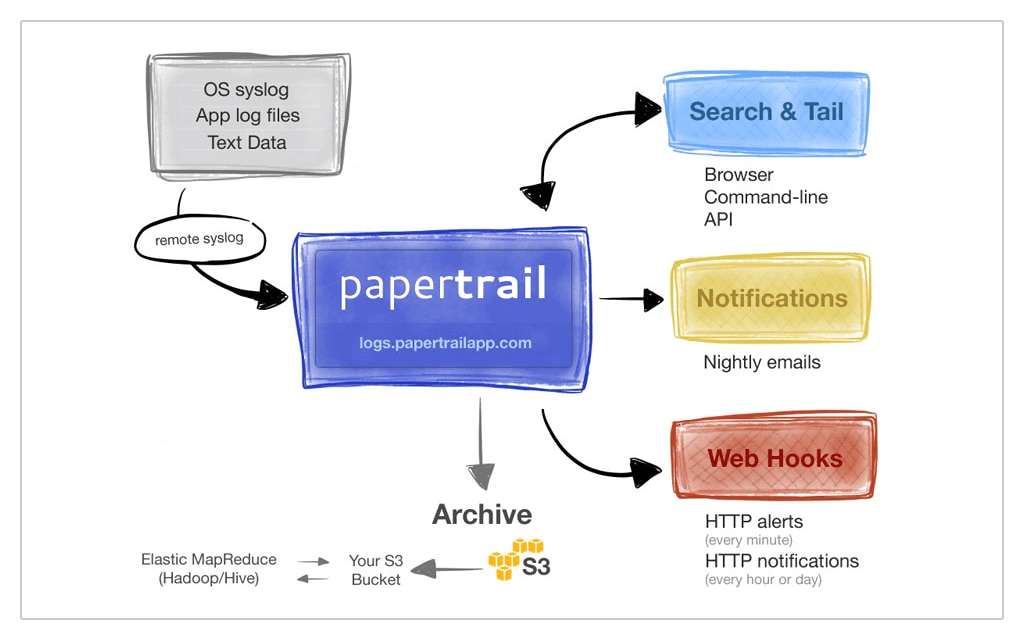
Decentralized logs require you to search in multiple locations, making it difficult to find the information you need. By consolidating all of your logs into one place, you can holistically analyze your entire software stack. You can send logs to SolarWinds® Papertrail™ directly using app logging libraries that support the syslog protocol, or by forwarding plain-text files with the Papertrail standalone remote2_syslog daemon. Papertrail supports automatic parsing of a variety of common logging formats and provides an intuitive interface for searching through them. And because your logs are stored in an Amazon S3 bucket, your log data benefits from high-availability and resiliency. You can even archive your logs and use them for long-term analysis, and you can control the global retention policy for all your backups and archives from one place. When your policies need to be updated, changing them is as simple as modifying the existing configuration and saving the new settings in Papertrail.
Sign up for a free plan
Troubleshoot faster
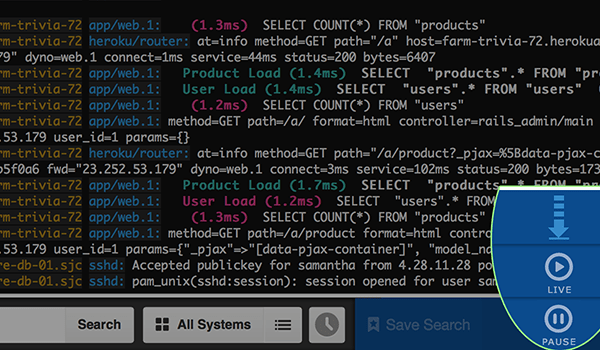
Papertrail supports a simple search syntax that allows you to quickly cut through the noise in your logs to home in on the details you’re looking for. Search for important phrases or use boolean operators to combine queries together. Filter your results based on time, origin, or custom fields to find traffic spikes occurring over the last few hours, or narrow your results to messages from a specific server. If you need even more control, you can use regular expressions to filter incoming logs and apply those filters individually to different systems, apps, and environments. The live tail feature lets you run search queries and filter log messages as they’re received in real time. Use clickable elements in the live tail output, such as IP address and UUIDs, to limit the output, speed up your analysis, and reduce the time to troubleshoot problems.
Sign up for a free plan
Proactively monitor with real-time alerts
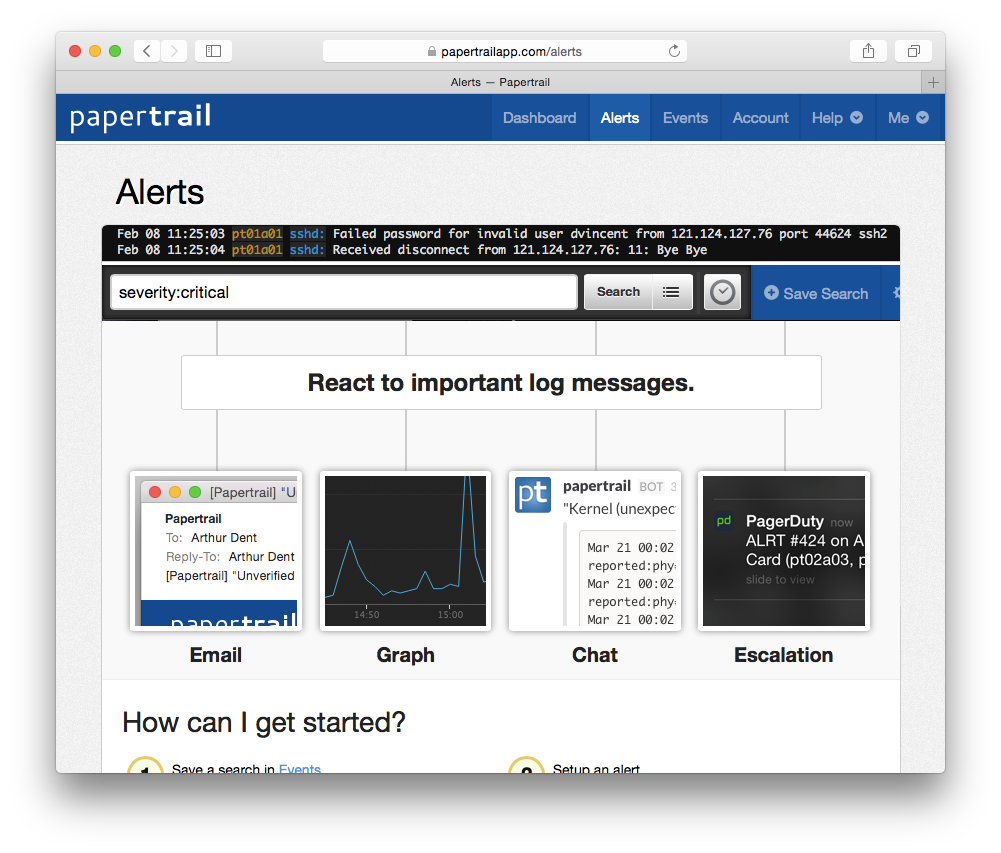
Catching issues before your users see them is critical for application teams. Turn your most important searches into alerts by assigning a schedule and running them every minute, hour, or day. If you need to be notified when an expected event doesn’t occur, such as when a backup or cron job fails, you can create an inactivity alert. Receive alert notifications over email or any collaboration tool your team uses. Papertrail supports sending notifications over Slack, PagerDuty, and Campfire. Alternatively, you can send notifications to your custom HTTP webhooks using a POST request and JSON payload, and build your own monitoring services tailored to your environment. For monitoring traffic spikes and increases in application latency, you can assign a minimum threshold to an alert so you only receive notifications when a specified number of events are matched within a chosen time interval, allowing you to ignore outliers and focus on critical problems.
Sign up for a free plan- Application Log Management
- Aggregate, monitor, and analyze all your logs in one place. Get the most out of your application logs with cloud-based log management software.