Add AppOptics to Papertrail for Easy, Affordable APM
-
Quick to Set Up and Easy to Use
Jump start your application performance monitoring with over 150 built in integrations, metrics, dashboards, and broad language support -
Full-Stack Visibility
Monitor the performance of highly distributed cloud applications across services, hosts, containers, and platforms down to the line of code -
Reduce MTTR
Quickly pinpoint issues with auto-instrumented root cause analysis and tight integration with SolarWinds® Papertrail™ log management

Here's how AppOptics and Papertrail can help

Take the Complexity Out of APM
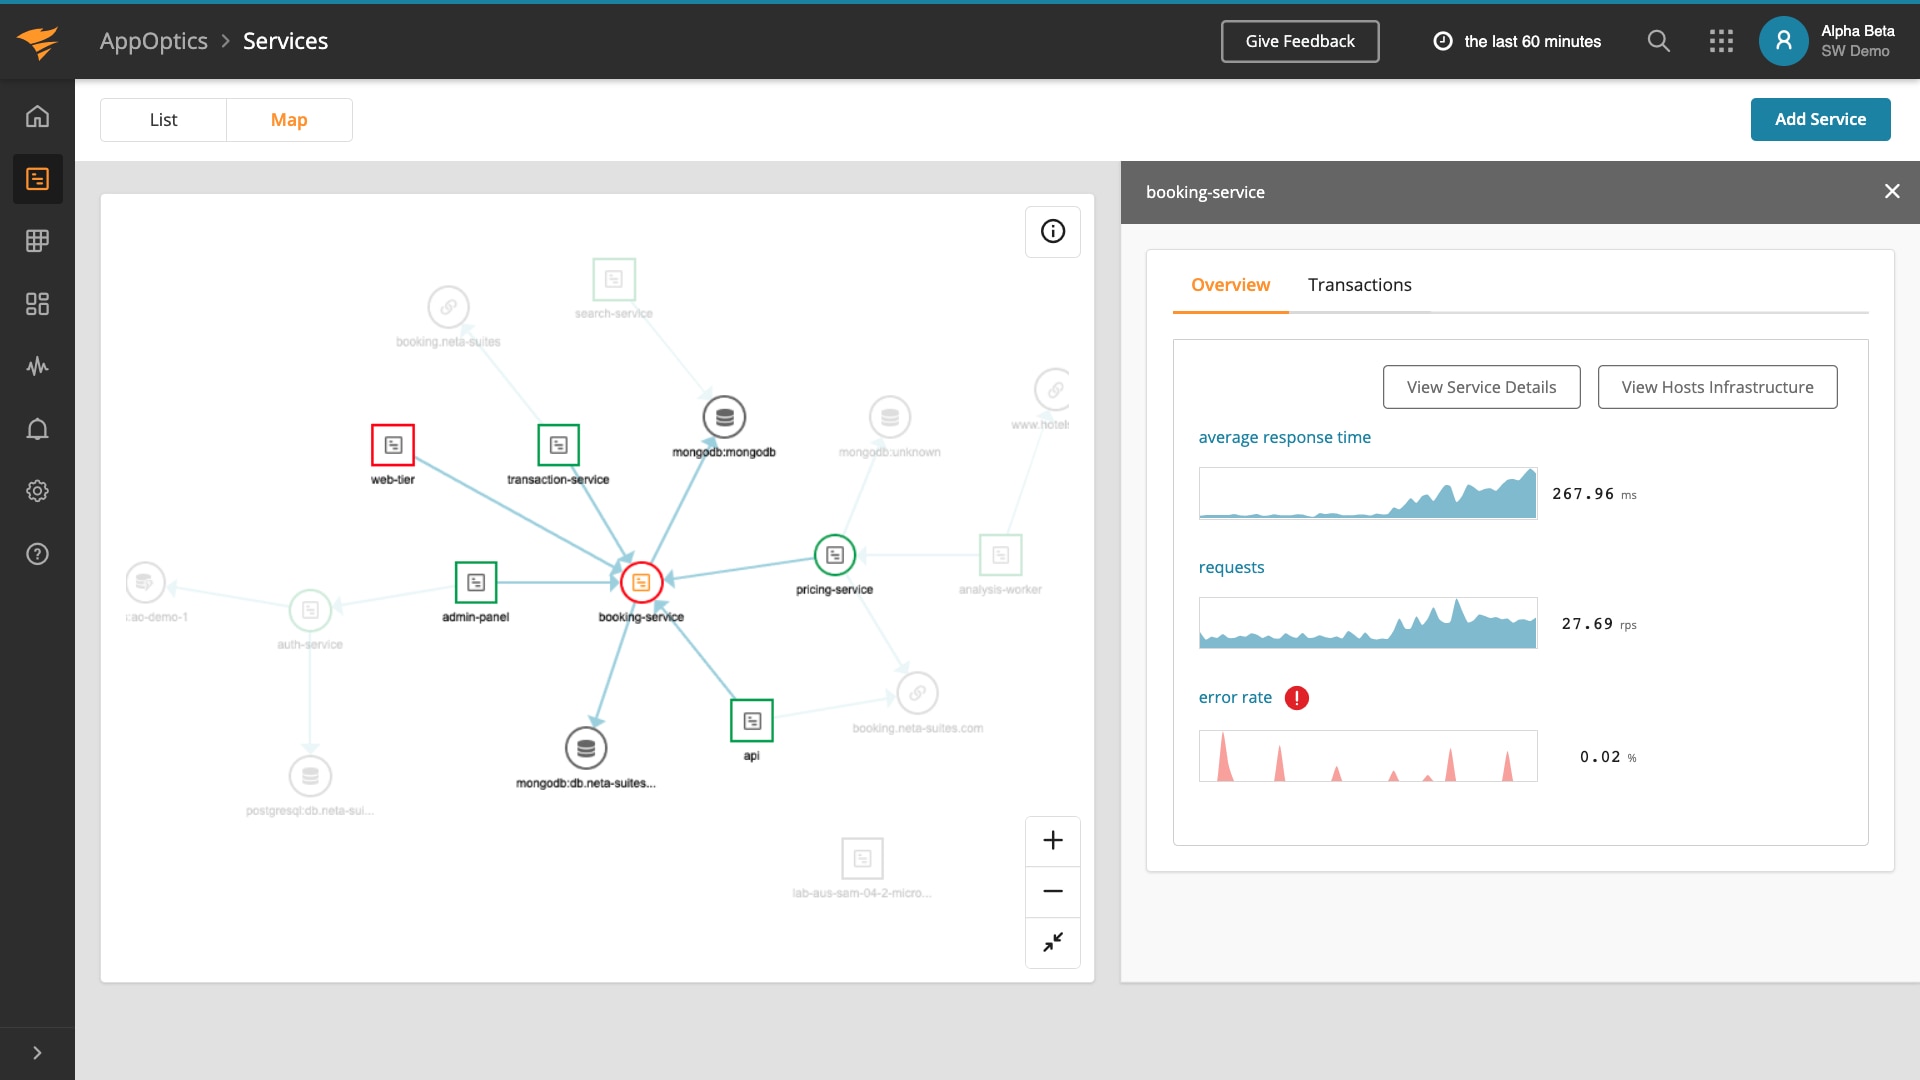
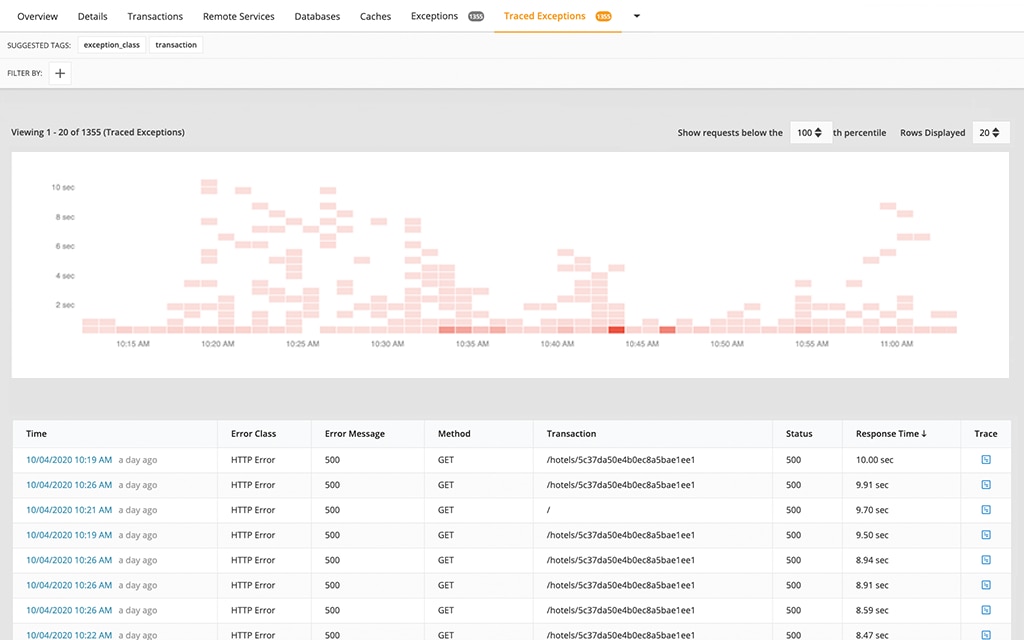
Simple to use even if you don’t have intimate knowledge of the application code. Automated views and color-coded heatmaps, trace-level summaries, and application service maps allow you to visualize performance, map dependencies, and identify bottlenecks.
• Up and running typically in minutes, easy to set up and use with a minimal learning curve for IT professionals
• Broad language support with out-of-the-box application metrics, dashboards, and auto-instrumented tracing
• Simple, auto-instrumented application service maps and unique service- and trace-level root cause summaries pinpoint performance issues for you

Comprehensive Monitoring
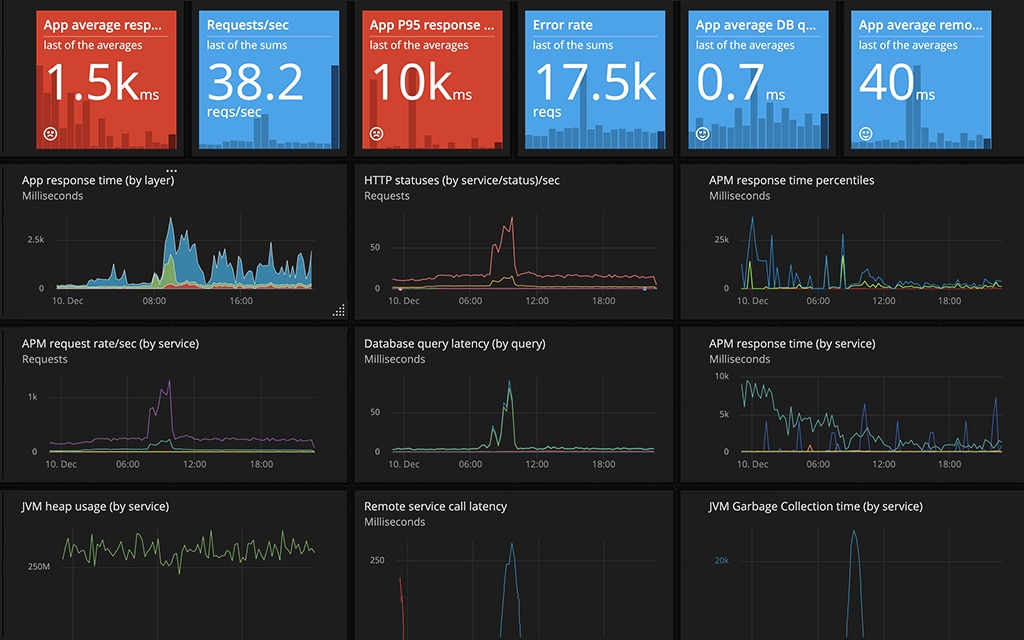
Unified dashboards, alerting, and management combine to provide complete visibility. SolarWinds AppOptics™ removes the wall between infrastructure and application metrics, enabling integrated dashboards and application performance alerting
• Complete visibility into the health and performance of applications and their underlying infrastructure
• Proactively monitor performance against metrics and thresholds and alert on performance or health abnormalities
• Visualize the impact host and container resources and availability are having on your application performance with combined dashboards
• Communicate and collaborate across the team with shared dashboards and reports

End-to-End Troubleshooting
Reduce mean time to resolution (MTTR) by combining metrics, traces, and logs for complete observability across platforms, hosts, resources, containers, applications, and services to quickly identify and resolve performance issues.
• Learn what the issue is from metrics and traces and why it occurred from logs
• Drill down into the log lines associated with a specific trace in one click
• Quickly jump from an alert or metric into the relevant logs to spot issues
• Validate root cause assessment with logs
- Application Performance Monitoring
- Combine metrics, traces, and logs for full-stack visibility and faster troubleshooting.