A Powerful Apache Log Viewer
-
Aggregate and analyze all your logs in the cloud
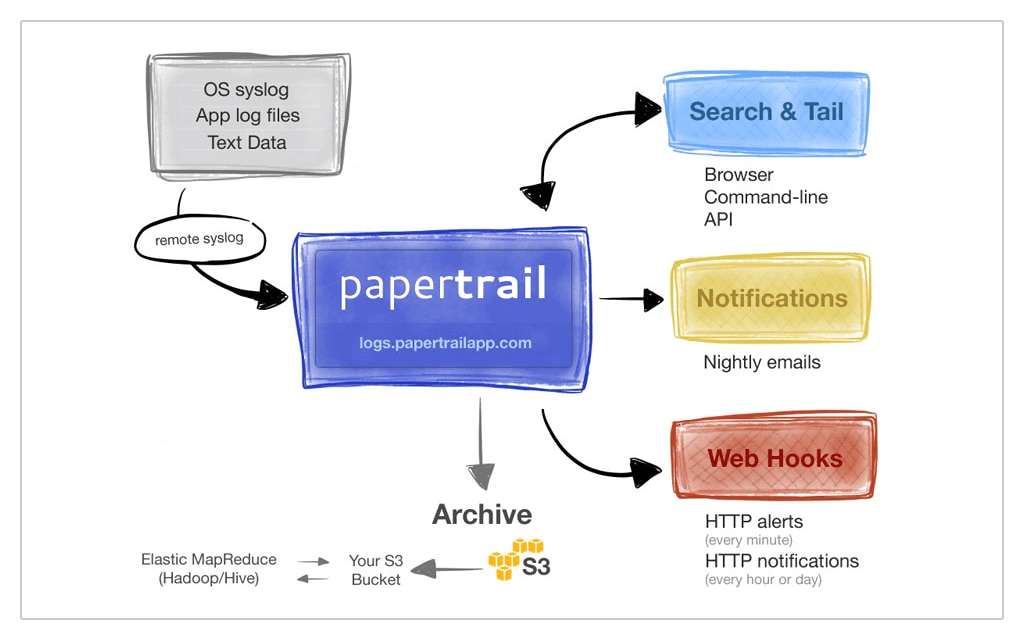
Aggregating all your Apache logs in the cloud gives you fast searching and filtering across all of your logs. -
Navigate logs with an intuitive interface
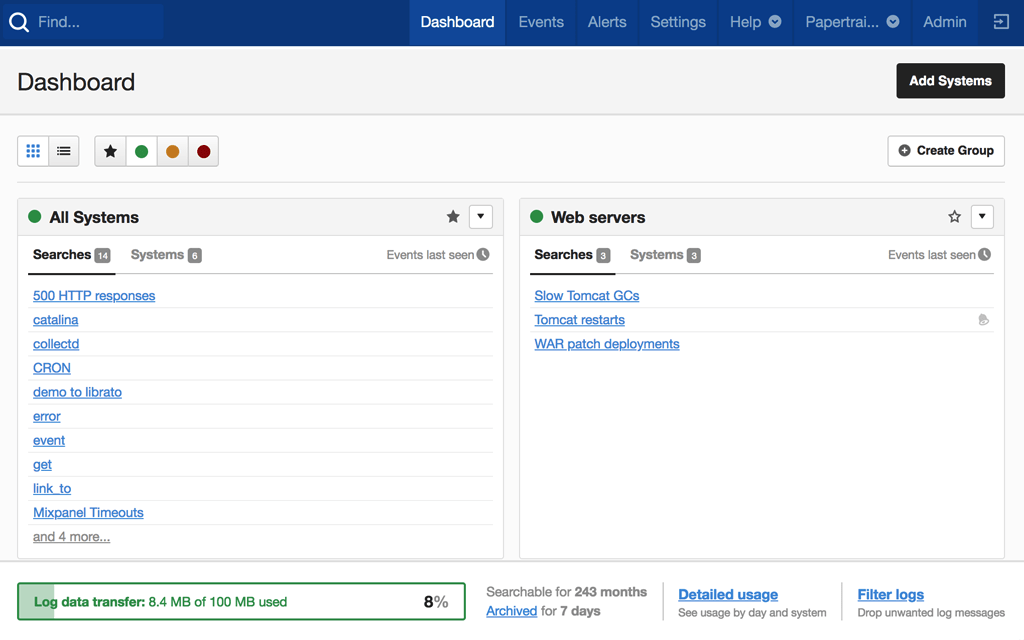
Quickly find related log messages and navigate through your logs using IP addresses and other HTTP request context. -
Proactively monitor and catch issues
Receive notifications whenever alerts trigger and build interactive visualizations of historical data to identify trends.

Here's How Papertrail Helps

Aggregate and analyze all your logs in the cloud
Aggregating all of your Apache logs into one central location makes it much easier to search through them and find the log data you need during analysis. Send logs from Apache web servers across your infrastructure and build a holistic picture of your web servers. Filtering your log data is lightning fast so no matter how many log messages you generate, you can narrow it down quickly and focus on the servers or user requests you’ve investigating. Using cloud storage to host your log files means your storage capacity scales with your log demands. Cloud storage also provides a simple way to archive your Apache logs for long-term analysis and meet your data retention policies. And because all of your log files are stored centrally, you can control user permissions by assigning users full or read-only access and by providing access to collections of files using log groups.
Sign up for a free plan
Speed up analysis with an intuitive interface
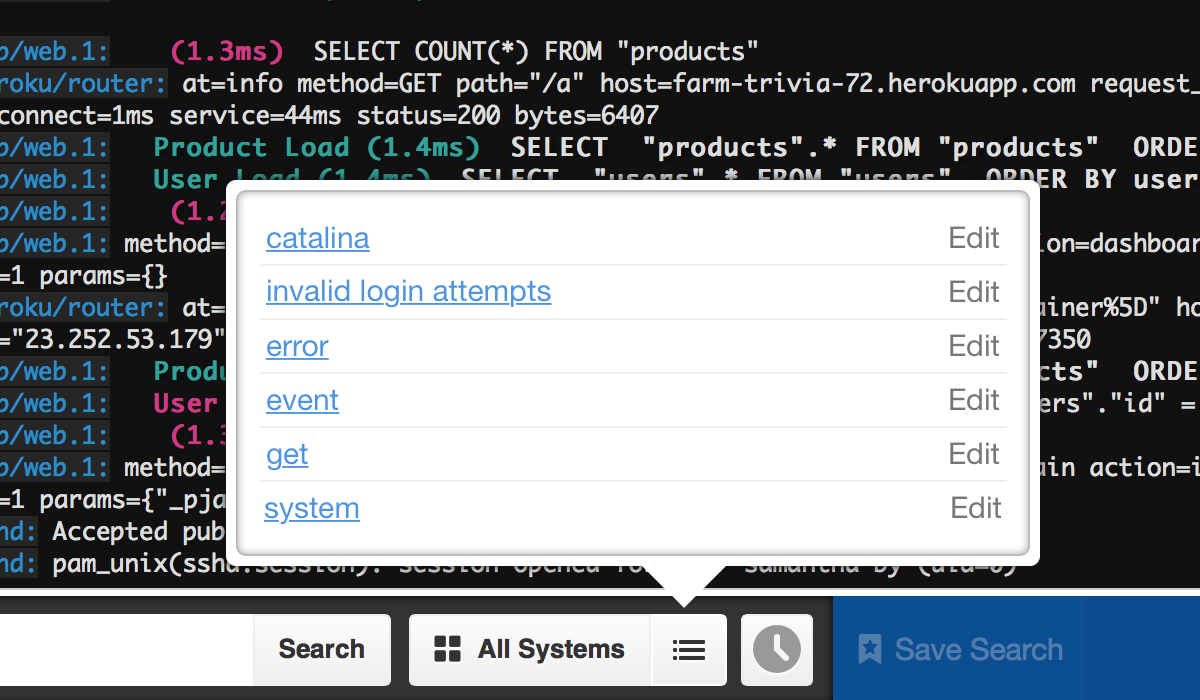
The SolarWinds® Papertrail™ central interface allows you to easily navigate through your Apache log messages with simple searching and filtering features. Filter log messages based on time, origin, and custom fields such as session ID. For more complex queries you can use regular expressions to cut through the noise, reduce the number of results, and speed up your analysis. Gain instant visibility into your infrastructure and server activity by viewing the live stream of events as they’re received by Papertrail. Pause, search, and scroll through live data to understand your app’s behavior in real time. With contextual search, you can establish a chain of events and trace the root cause of a problem back to its source. Click on elements in the event viewer to quickly jump to specific servers or click on IP addresses to find all requests from a single user. Contextual searches also allow you to see all log messages in a multi-line exception.
Sign up for a free plan
Catch issues early with monitoring
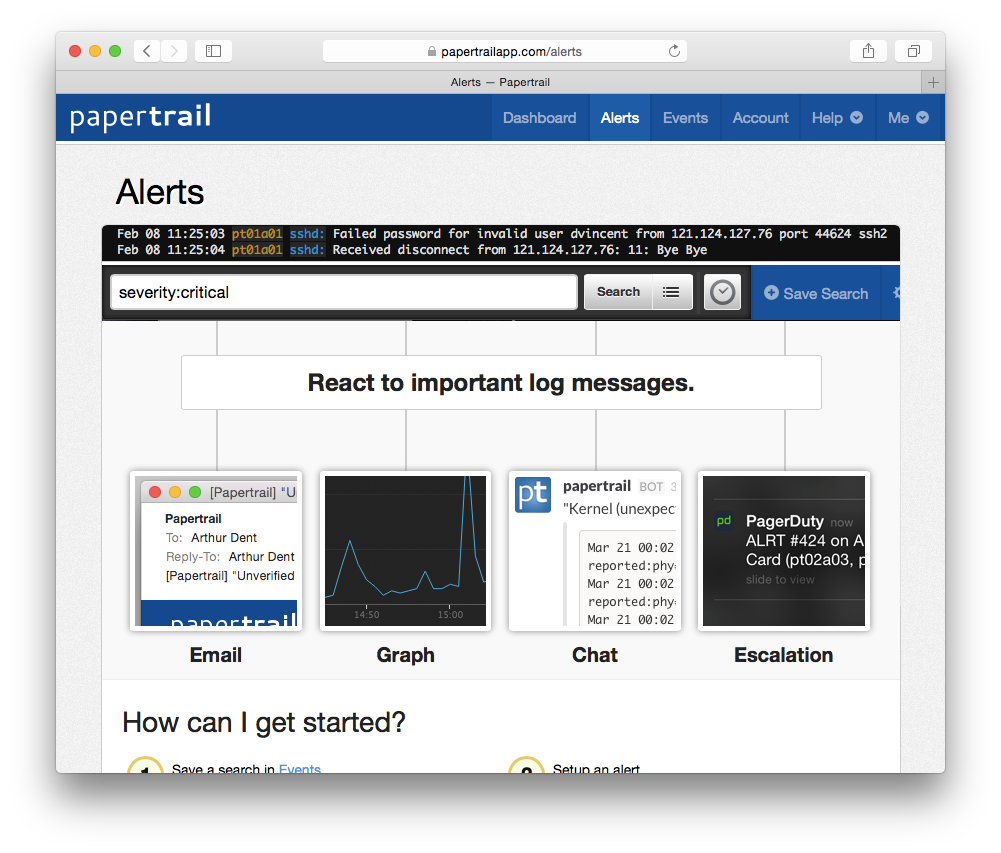
Identify minor issues before they snowball into major incidents with automatic monitoring of your Apache logs. Papertrail allows you to turn your saved searches into alerts by scheduling them to run with a specified period. By scheduling alerts to run every minute, hour, or day, you can tailor your alerts to closely monitor critical events, such as spiking error rates, as well as generating daily summaries such as number of active users. With inactivity alerts, you can detect when an expected event doesn’t occur, such as when a backup fails or a cron job doesn’t run. Receive notifications via email when alerts trigger. If your team is using collaboration tools such as Slack, PagerDuty, or Campfire, you can receive alerts using Papertrail support for third-party services. Papertrail even supports sending alert notifications to custom HTTP webhooks, which allows you to build your own monitoring tools.
Sign up for a free plan- Apache Log Viewer
- Aggregate, monitor, and analyze all your logs in one place. Get the most out of your Apache logs with cloud-based log management software. Looking for something more advanced? Check out the SolarWinds Apache Log Analyzer