Real Time Apache Log Analysis
-
Aggregate and analyze all your logs
Collect all your files in one place, and automatically scan events as they happen to get real-time insights. -
Reduce mean time to resolution (MTTR)
Quickly trace issues back to the source to find the root cause faster, so you can start remediation efforts sooner. -
Proactively monitor and catch issues early
Detect trends sooner so you can spot issues early before there’s a service impact.

Here's How Papertrail Helps

Aggregate and analyze all your logs
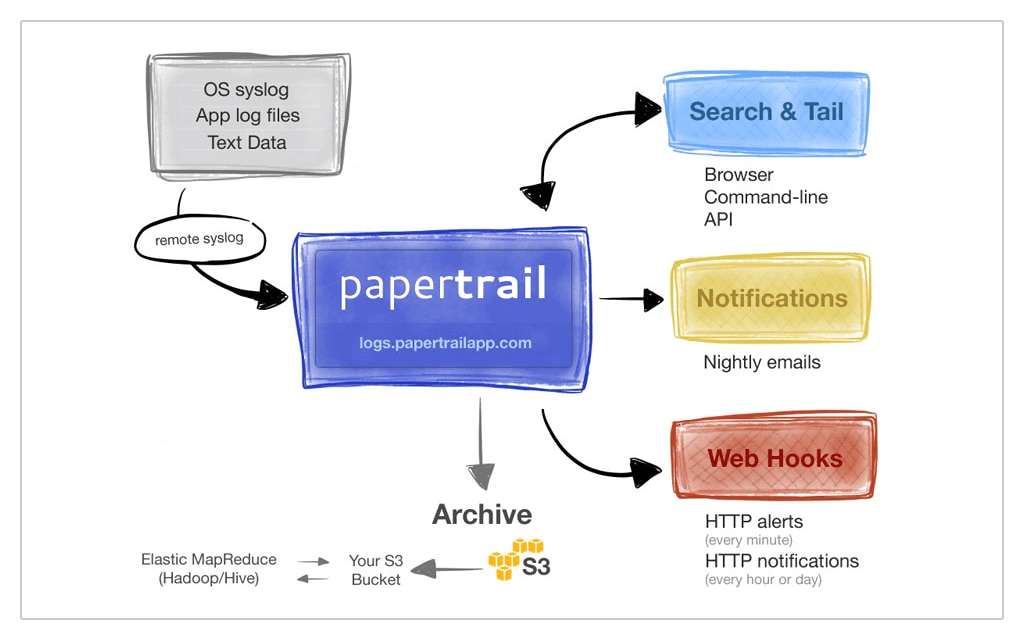
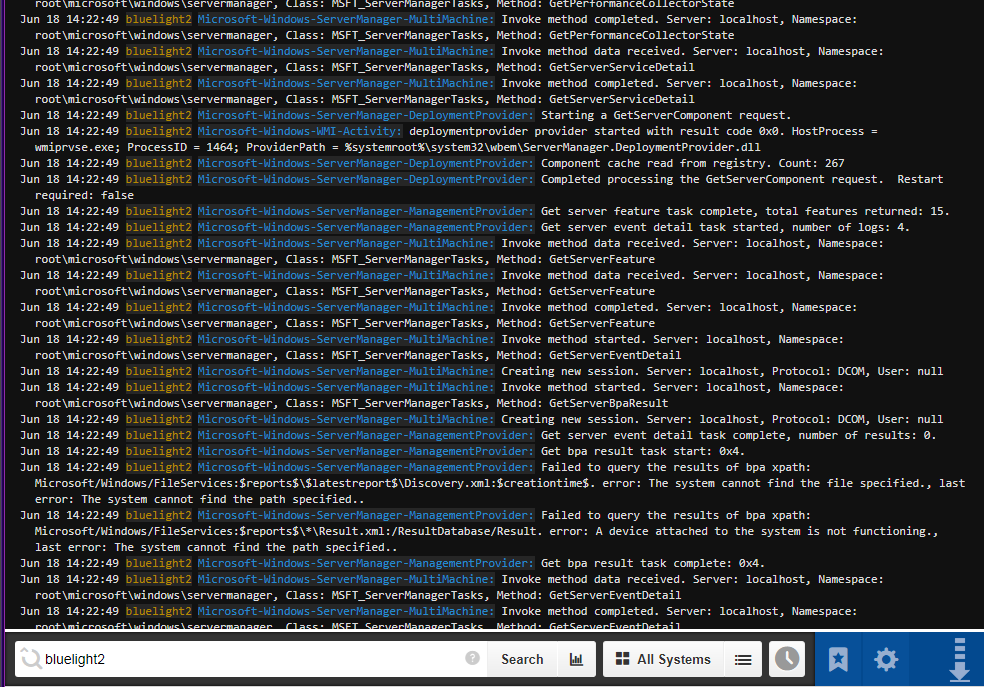
Searching through logs stored on individual web servers can add significant delays when analyzing problems. Consolidating all your Apache logs into one place makes it much faster to diagnose and resolve issues, no matter where they appear in your infrastructure. By using a central interface to access all of your data at once, you can understand the bigger trends and spot patterns in your data . Whether you’re running one Apache server or a thousand, aggregating your logs in the cloud with SolarWinds® Papertrail™ helps you trawl through log data to find the messages you need when you need them using a simple search syntax. Automatically back up your log data and archive it for later retrieval. You can configure archives to be retained for a specific period or forever, allowing you to customize how your log data is stored so you can implement your retention policies.
Sign up for a free plan
Reduce mean time to resolution (MTTR)
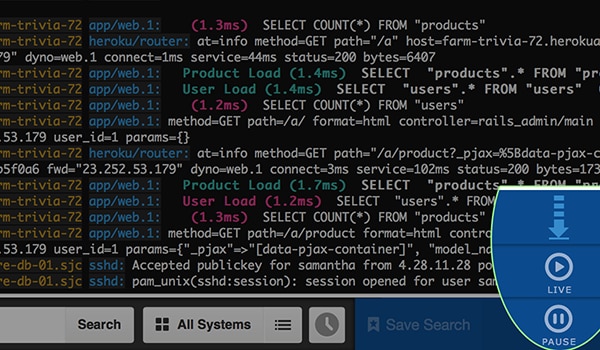
Busy Apache servers generate huge logs and finding the messages you need can be a challenge. With simple search syntax and filtering features from Papertrail, you can cut through the noise, single out the information you need, and reduce troubleshooting time. Filter events by time, origin, or use custom fields such as session ID to create powerful search queries. If you need even more control, you can use regular expressions to build more complex search strings. When faced with transactions involving multiple messages, Papertrail log analyzer lets you navigate the chain of events and find the root cause of problems. The live tail feature allows you to view logs in real time. Search and filter logs as they’re received and limit tailed logs to specific devices and services. You can even live tail logs on the command-line using the Papertrail CLI and display the output of search results using color highlighting to speed up analysis.
Sign up for a free plan
Proactively monitor and catch issues early
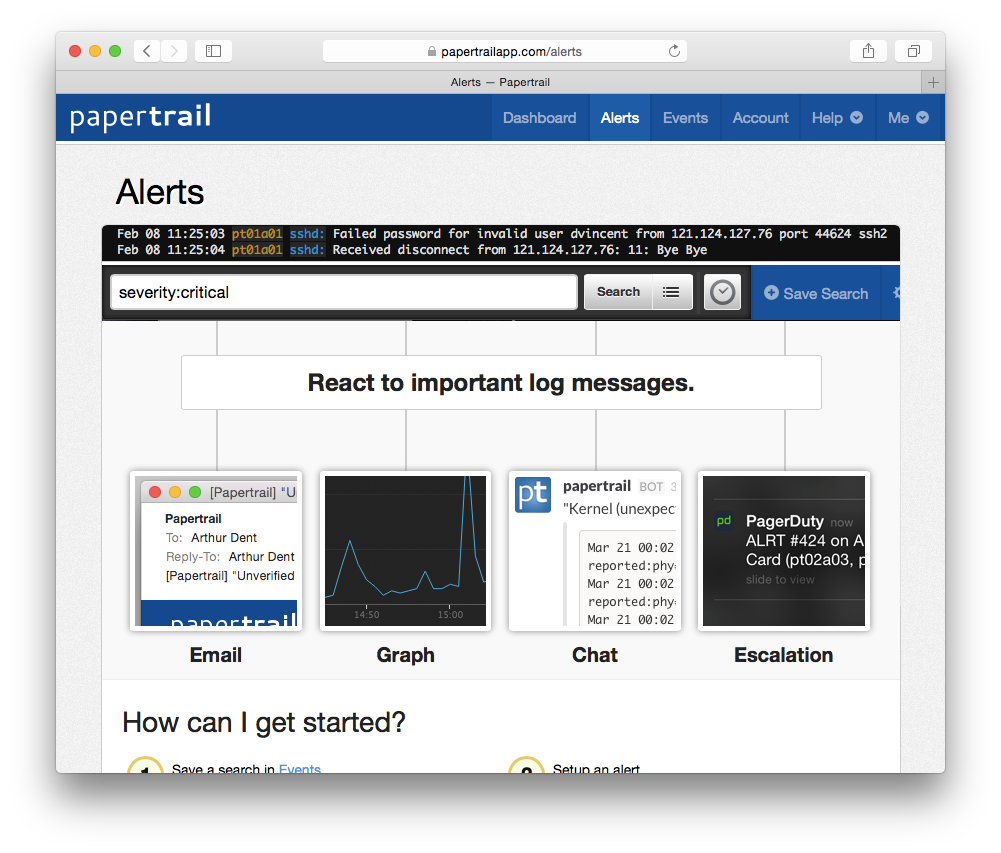
Monitoring your Apache servers by manually running searches makes it easy to miss problems, and it simply doesn’t scale. Turn your most frequent searches into alerts and catch issues before they affect your users. You can schedule your alerts to run every minute, hour, or day. Using inactivity alerts, you can discover when an expected event didn’t occur, which can be incredibly useful in making sure your Apache servers are processing requests correctly. When an alert triggers, you can receive notifications by sending them over email, or by using your team’s chosen collaboration tool, such as Slack, PagerDuty, or Campfire. You can even send alert notifications to custom HTTP endpoints. Sometimes the best way to identify problems is by visualizing your data. Log velocity analytics helps you understand how often events occur, and spot patterns and anomalies in your log data, making it perfect for troubleshooting traffic spikes from the last 10 minutes, or spotting trends over the last two weeks.
Sign up for a free plan- Apache Log Analyzer
- Aggregate, monitor, and analyze all your logs in one place. Get the most out of your Apache logs with cloud-based log management software. Need something more advanced? Check out SolarWinds SEM Apache Log Analyzer.