Simplified Angular Log Analysis
-
Filter logs to cut through the noise
Quickly find the log messages you need by searching across all of your logs from a central interface. -
Visualize data to identity trends
Easily identify trends and patterns by building interactive visualizations from your log data. -
Establish root causes with improved log context
Discover which log messages are related to a user request by using context links to create infrastructure-wide history.

Here's How Papertrail Helps

Filter logs to cut through the noise
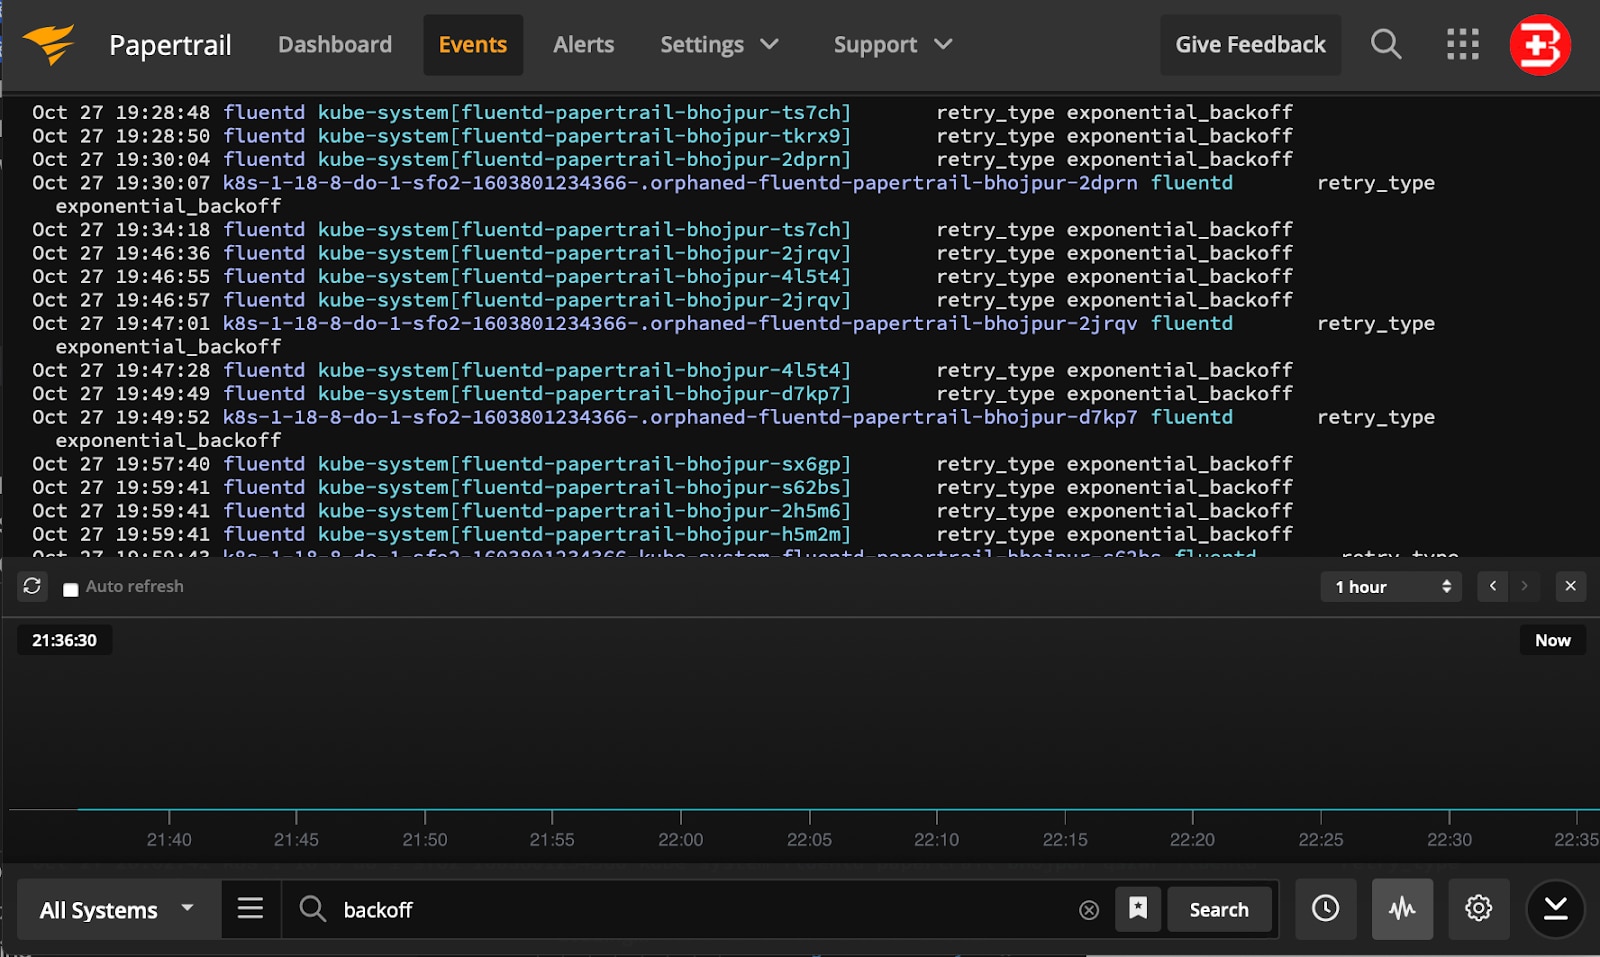
With all of your logs aggregated in one place, it’s simple to search through all of your log messages to pull out the data you need. Thanks to the simple search syntax, it’s easy to find messages containing specific strings such as IP addresses, app names, or hostnames. Cut down huge log volumes using filters and avoid being distracted by noise. Filter logs based on time, origin, and even custom fields such as session ID. If simple filters aren’t powerful enough for you, you can use regular expressions to create complex queries with improved precision to get the job done. Clickable events simplifies navigating the chain of events and tracing an incident back to its source. Seek through your log messages based on timestamps with a couple of clicks and narrow down the period of events to make troubleshooting easier.
Sign up for a free plan
Visualize data to identify trends
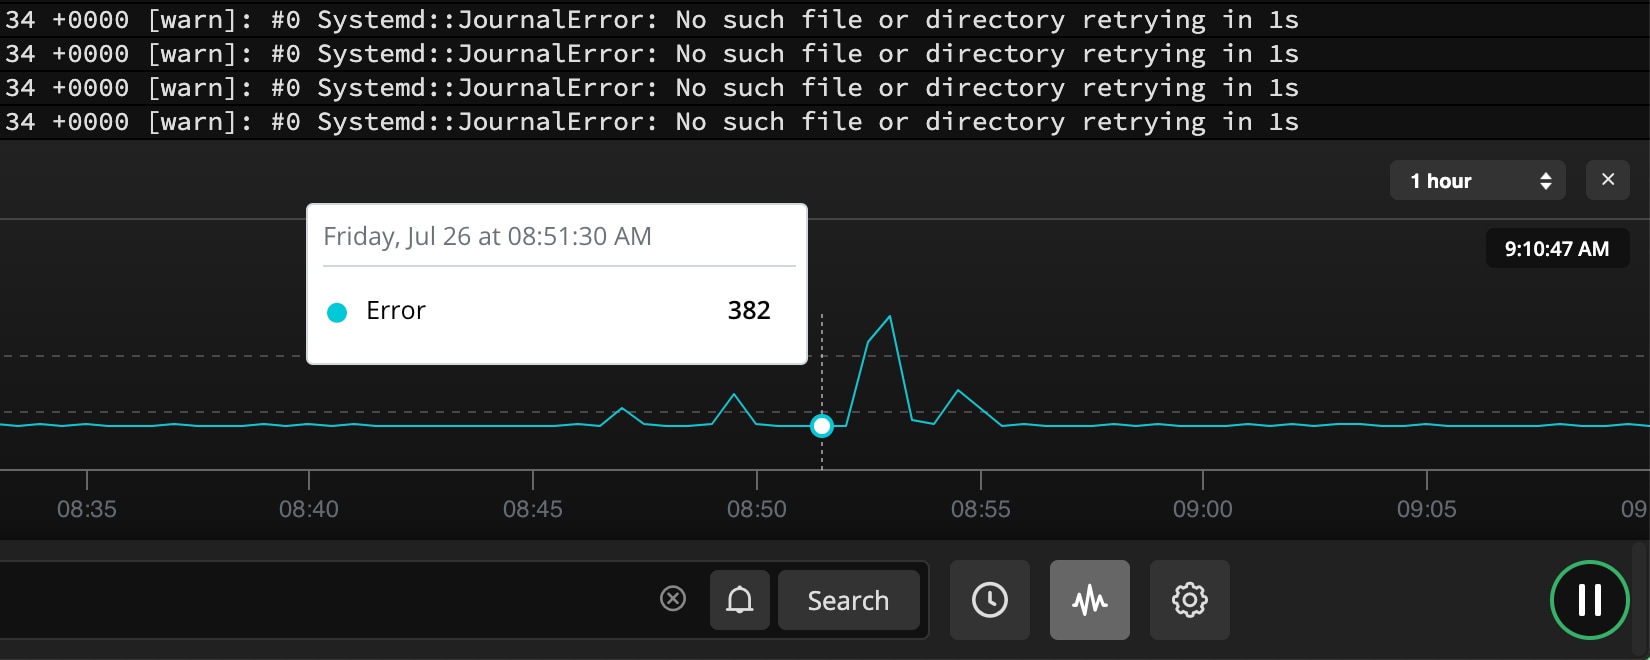
Transform your log data into an interactive graph to uncover patterns and trends using log velocity analytics. Log velocity analytics include clickable elements, so you can quickly switch from a big-picture view to looking at low-level event details. You can jump to events occurring at specific times by clicking on the log data and reduce the time it takes to investigate incidents. Visualizing historical data, you can quickly spot increasing error rates over the last two weeks or identify latency spikes from the last few hours. Save useful searches for later use or turn them into alerts by scheduling them to run every minute, hour, or day. And when alerts trigger, you can receive notifications via email or several third-party collaboration tools such as Slack, PagerDuty, and HipChat.
Sign up for a free plan
Establish root causes with improved log context
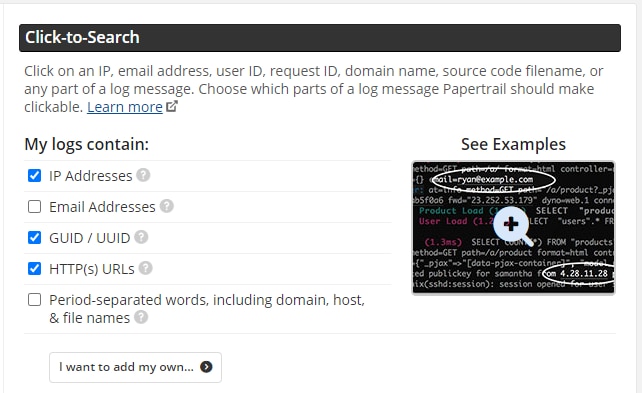
It can be difficult to trace user requests across apps and services when multiple software components are involved. Context links help you create an infrastructure-wide history, so you can seamlessly follow user requests and reduce the time to troubleshoot even the most complex issues. Use identifiers such as IP address or user ID to search all your logs simultaneously, no matter which server they were created on. Clicking on an identifier in Papertrail’s event viewer will filter out all other log data and show you the relevant messages matching your identifier, which can greatly reduce the size of the log data you need to analyze and help you establish a root cause for the issue you’re troubleshooting. Many Angular apps produce multi-line log messages which can easily become mixed up in aggregated logs. Using identifiers to narrow down search results allows you to all of the log messages lines at once and analyze errors and exceptions with full context.
Sign up for a free plan- Angular Logging
- Aggregate, monitor, and analyze all your logs in one place. Get the most out of your Angular logs with cloud-based log management software.
Need something more advanced? Check out the SolarWinds Ubuntu Log Analyzer