A Simple Android Log Viewer
-
Aggregate and analyze all your logs
Aggregate and parse all your logs in a central location to build a full picture of your Android devices -
Filter out the noise
Trim down large log files and focus on just the pieces you need with advanced searching and filtering -
Visualize your logs
Uncover patterns and trends in your log data by creating interactive visualizations

Here's How Papertrail Helps

Aggregate and analyze all your logs
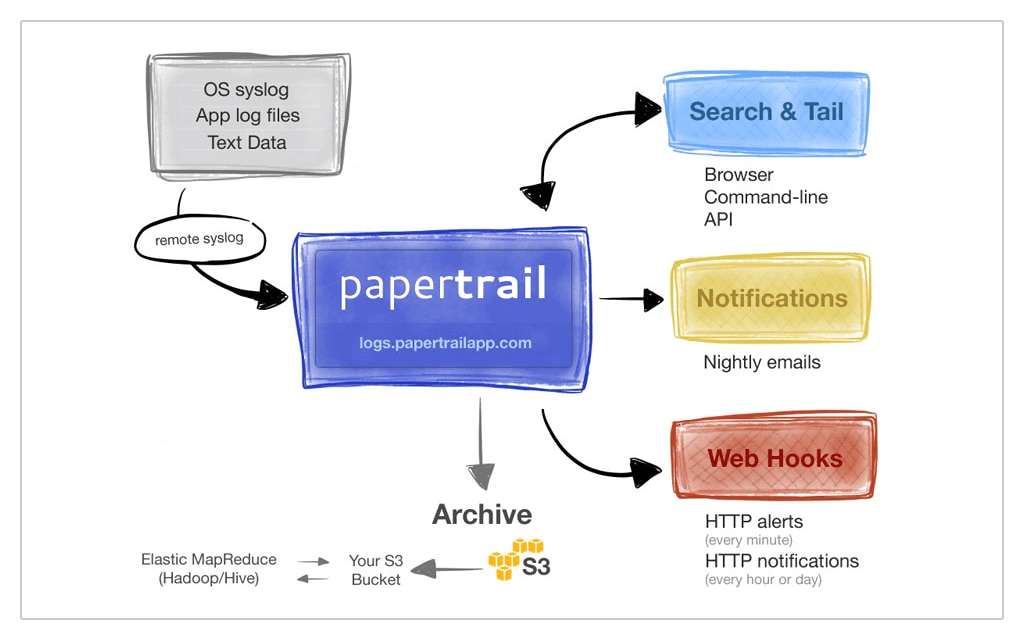
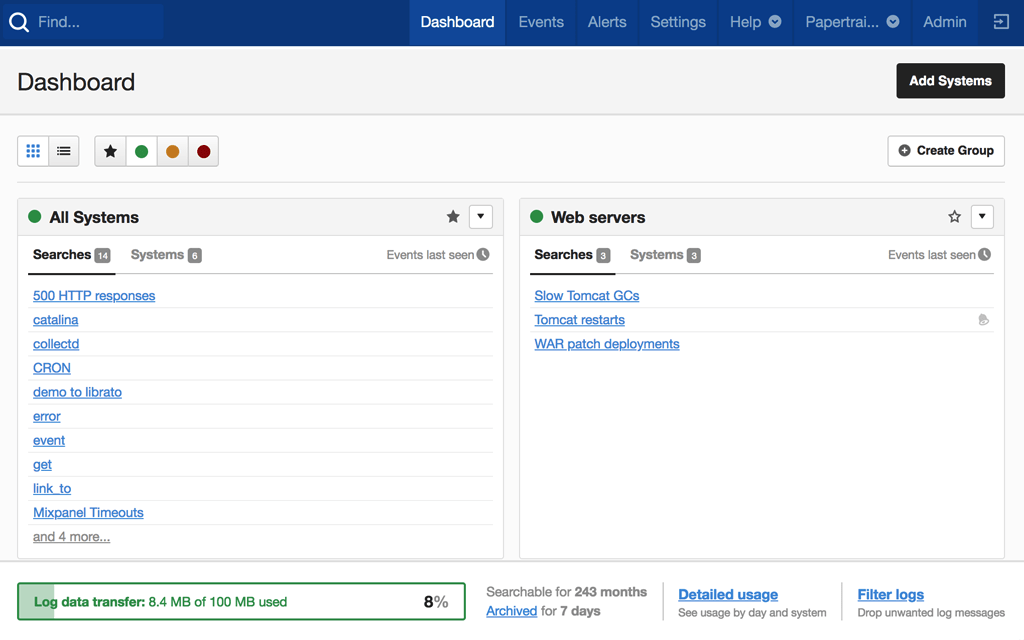
Storing all of your logs in a central location allows you to build a complete picture of your apps and services from across all your devices and analyze them all at once. Send logs from any Android application using either logback-android or logback-syslog4j and automatically parse the log files. Log files are stored in an Amazon S3 bucket, which provides nearly unlimited, high-availability storage for your data, and the scalability of S3 buckets means you can expand capacity as your log data grows and easily meet your data retention policies. Archive log data for long-term analysis and control the security of your log files by customizing which users have full and read-only access. The log groups feature lets you organize your log files into categories and map access control to the way your team works.
Sign up for a free plan
Reduce Mean Time to Resolution (MTTR)
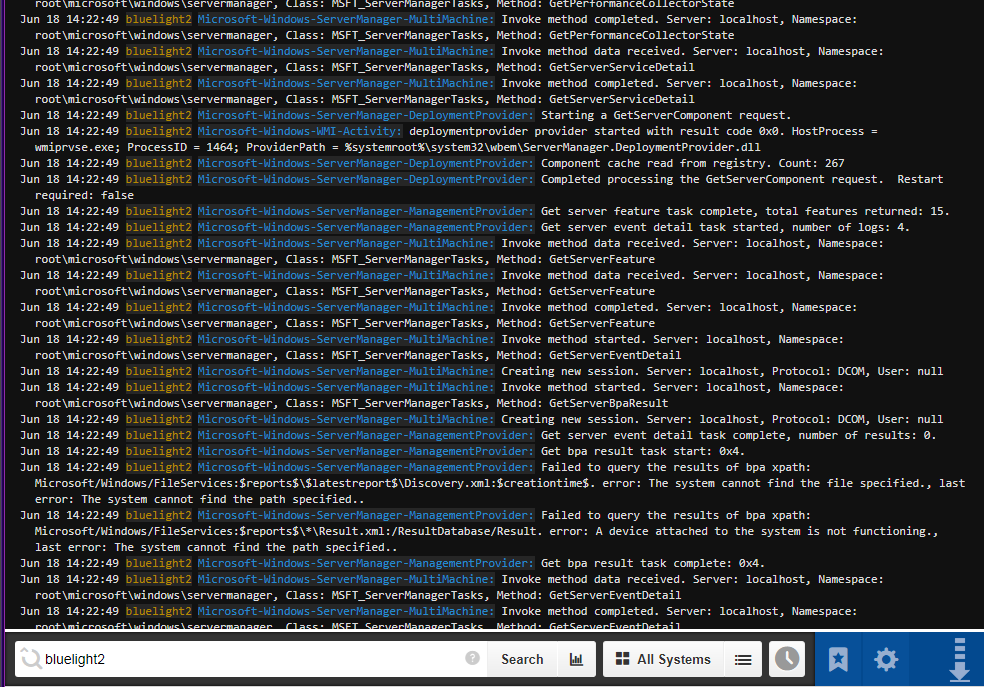
Using the SolarWinds® Papertrail™ easy search feature, you can find the log messages you want even with huge volumes of log files. The simple search syntax is intuitive and familiar, and it allows you to search for IP addresses, error strings, or system names. Speed up analysis by connecting events across apps and services using attributes in your search to constrain the list of results. New log messages appear in real time, giving you increased visibility into your software. Filter logs events by time, origin, or even custom fields such as session ID. If you demand more control over which messages you see, you can create powerful regular expressions to trim down the volume of logs and pull out just the data that you need. Highlight important strings with ANSI color support to make it easier to find what you’re looking for and reduce the time to find the root cause of issues.
Sign up for a free plan
Visualize your logs
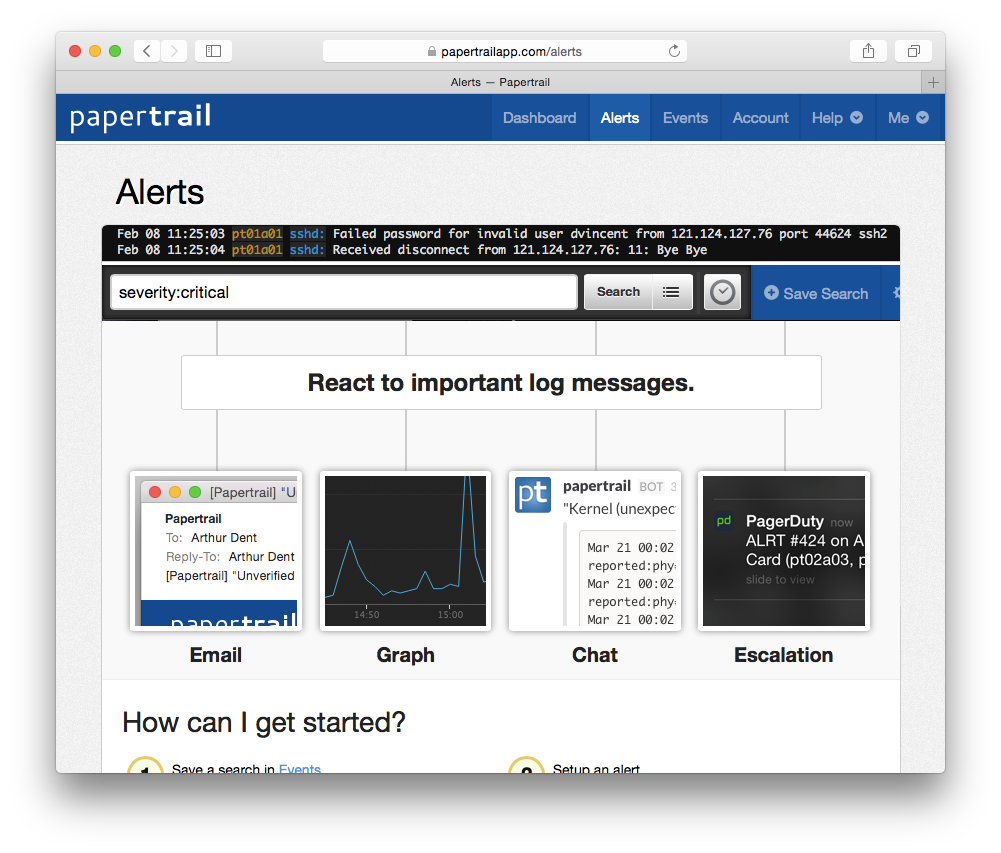
Uncover patterns and trends in your logs data by creating interactive visualizations. Charts contain clickable elements to help you switch from a big-picture view to looking at event details. Catch issues earlier by turning saved searches into alerts and assigning a schedule to run them every minute, hour, or day. The range of alert intervals makes it easy to frequently monitor critical metrics, such as crashes, as well as generating daily summaries from less urgent metrics. With inactivity alerts, you can even trigger alerts when expected events don’t occur and catch failed backups and cron jobs. Receive notifications via email when alerts trigger, or if you’re using third-party collaboration tools, you can send notifications directly to Slack, HipChat, or PagerDuty and make sure your whole team knows about any incidents as soon as they happen. Papertrail also supports sending alert notifications to custom webhooks, so you can send notifications to your custom monitoring software.
Sign up for a free plan- Android Log Viewer
- Aggregate, monitor, and analyze all your logs in one place. Get the most out of your Android logs with cloud-based log management software.
Need something more advanced? Check out the SolarWinds Apache Log Analyzer