Analyze access logs in real time
-
Aggregate access logs in the clouda
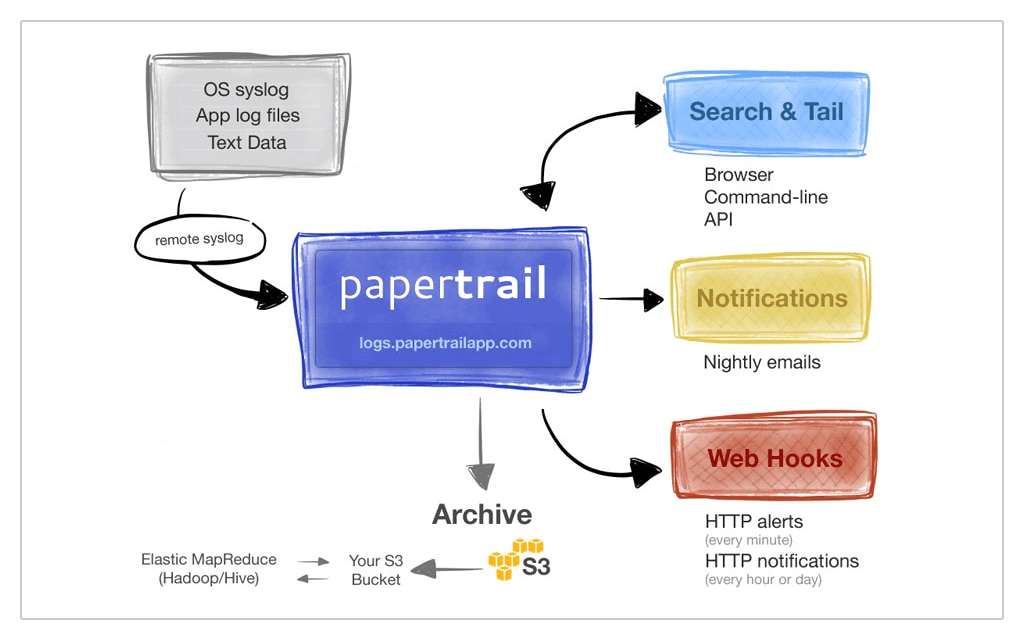
Store all your logs in the cloud and easily archive data for future analysis. -
Filter out the noise
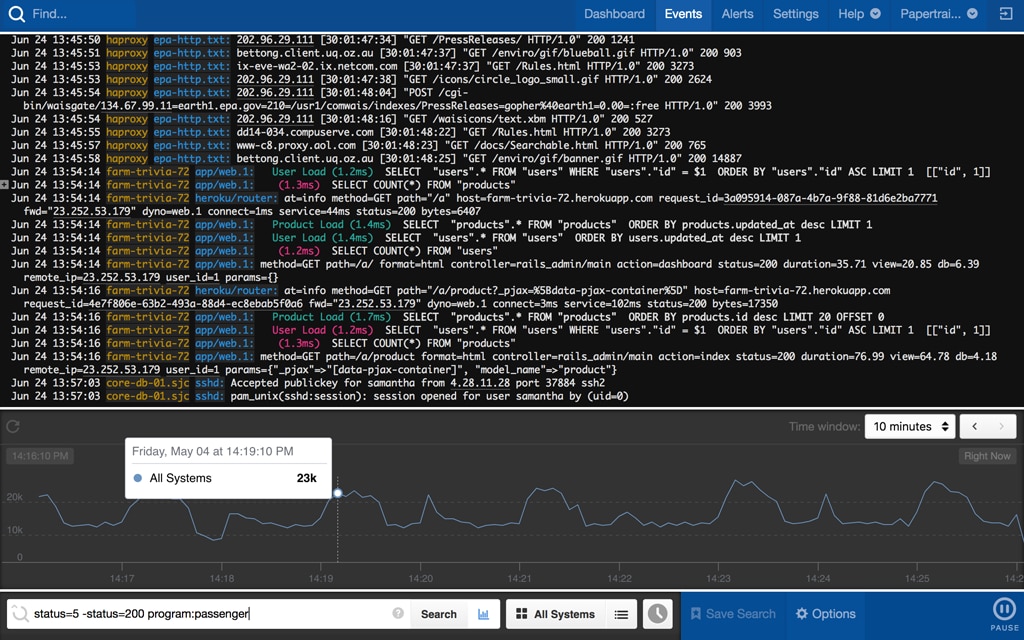
Search through all your access logs in real time and filter out unimportant messages during investigations. -
Receive alert notifications
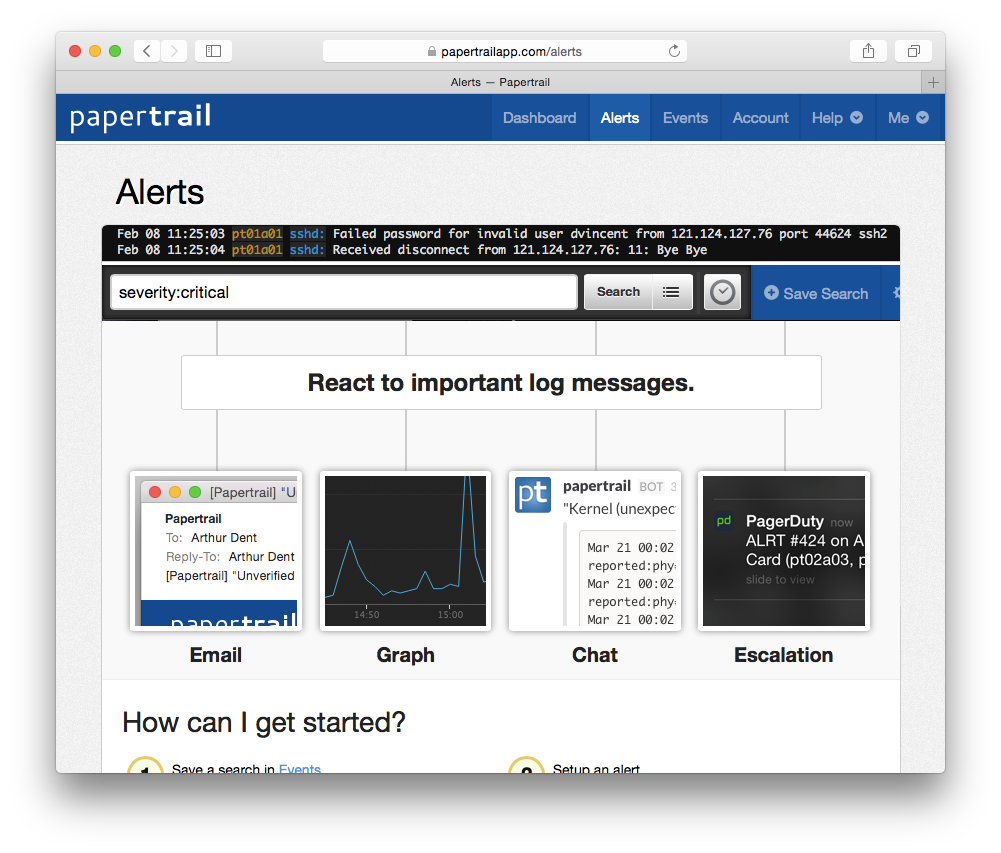
Monitor your logs and receive notifications whenever your alerts trigger.

Here's How Papertrail Helps

Aggregate access logs in the cloud
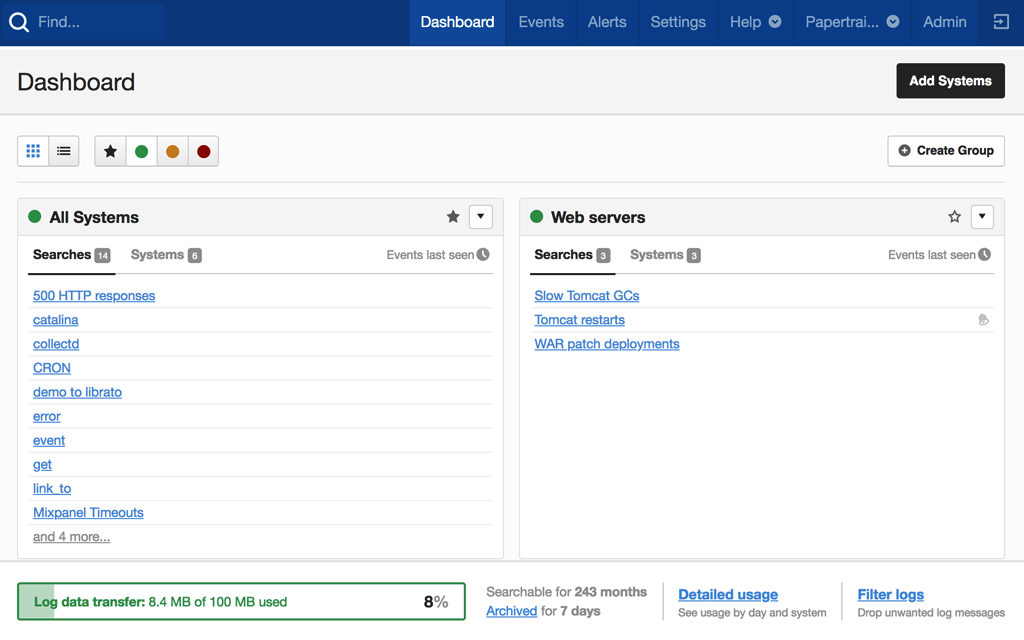
Consolidate all your access logs into a single location and build a holistic view of your infrastructure. Using the SolarWinds® Papertrail™ central interface, you can view all of your access logs and analyze messages no matter which systems or service they’re generated on. All of your logs are stored in an Amazon S3 bucket that provides almost limitless storage and high-availability. With S3 buckets, you can archive your log data for long-term analysis and meet your log retention policies. The central interface allows you to control those policies in one place and help ensure your data is always kept secure by configuring which users have access to which logs. Users can be granted full or read-only access to logs, and with log groups it’s easy to provide users with access to collections of log files.
Sign up for a free plan
Filter out the noise
Identify the messages you need in your logs quicker using intuitive searching and filtering capabilities. The Papertrail search syntax supports standard boolean operators to help you easily cut through the noise in your logs and extract just the pieces you’re looking for. Filter results based on time, origin, and custom fields such as session ID. If you need more powerful ways to reduce the size of your logs, you can use regular expressions and create the perfect filter. The live tail feature lets you see incoming log messages and filter them in real time. Limit tailed logs to specific devices and systems or colorize log messages to highlight important strings. Tail your logs from the command line using the Papertrail CLI and convert the output to the common JSON format for integration with other tools and services.
Sign up for a free plan
Receive alert notifications
Manually reading through access logs to catch problems simply doesn’t scale. Turn your saved searches into alerts by scheduling them to run automatically. You can configure alerts to run every minute, every hour, or every day, making it possible to quickly identify critical conditions and create daily summaries of metrics. Inactivity alerts allow you to detect when an expected event doesn’t occur, such as when a backup doesn’t start or a cron job doesn’t run. Get notifications by email as soon as your alerts trigger and optionally choose the minimum number of events required before an alert is triggered. You can also receive notifications over third-party collaboration tools such as Slack, PagerDuty, and HipChat, so you can always be sure your entire team is aware of any incidents as soon as they happen. If you’re running your own monitoring software, you can send notifications to custom HTTP webhooks whenever your alerts trigger.
Sign up for a free plan- Access Log Analyzer
- Aggregate, monitor, and analyze all your logs in one place. Get the most out of your access logs with cloud-based log management software.