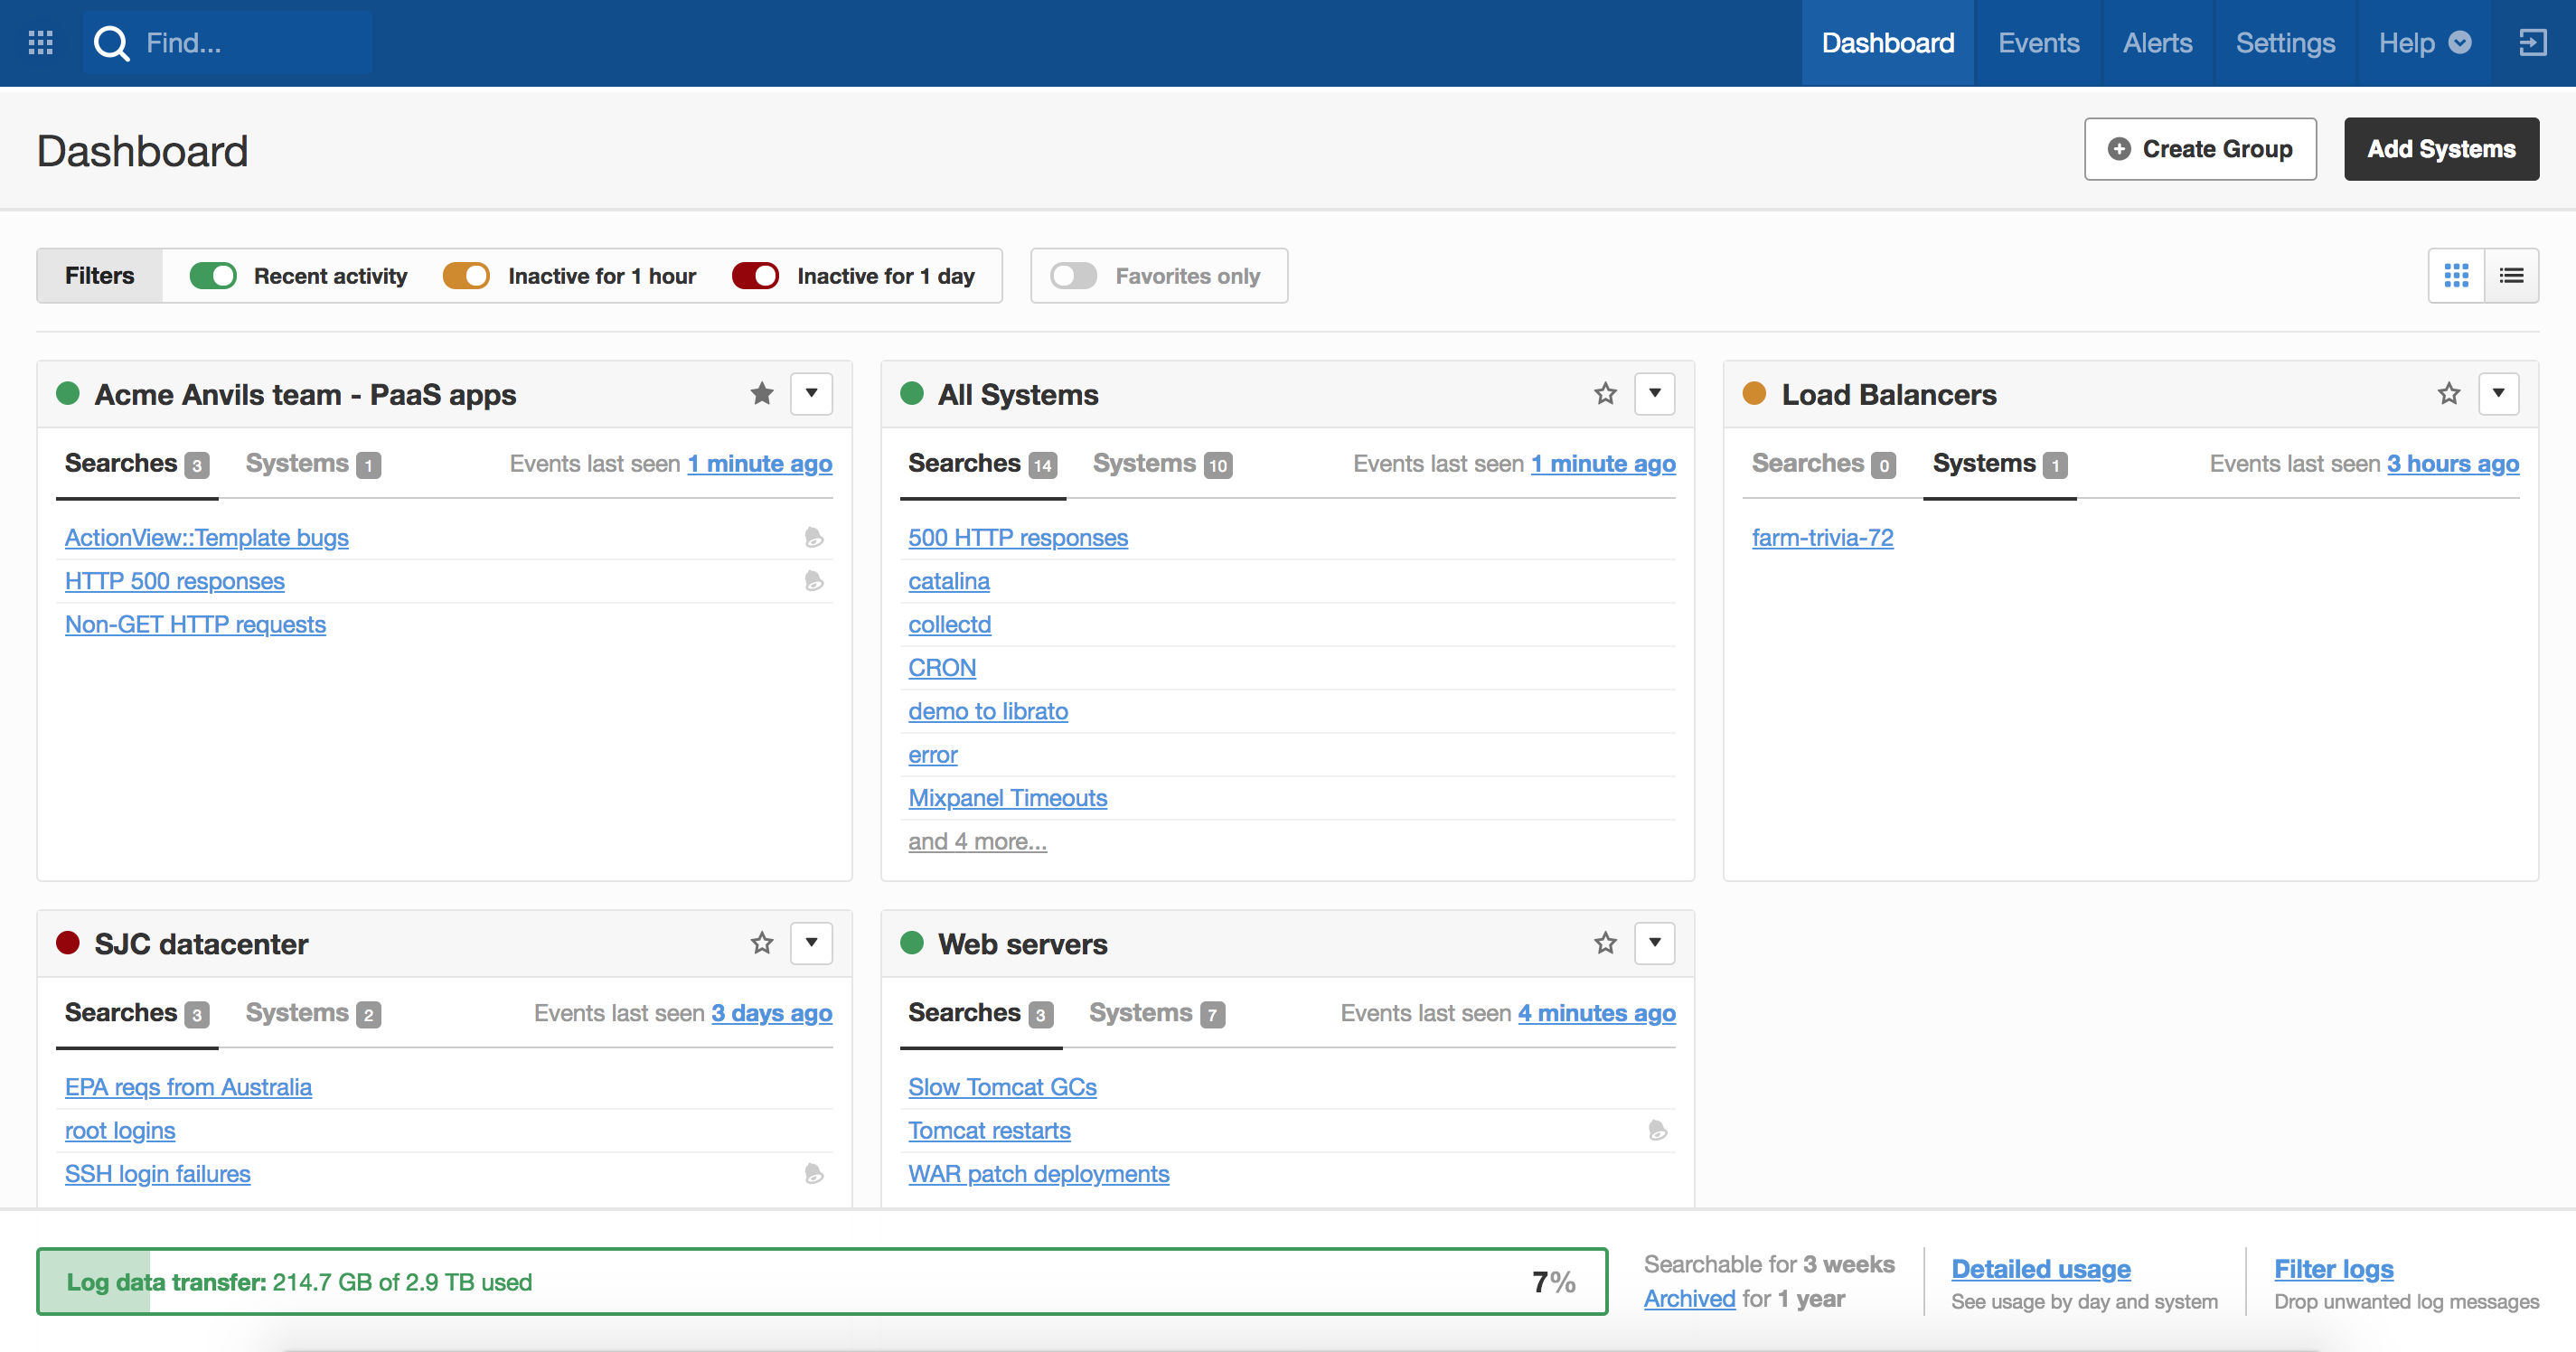
We’ve recently rolled out several long-overdue improvements to the Papertrail™ dashboard. The old dashboard was adequate, but it didn’t do a great job of showing larger accounts with many groups, searches, or systems. Lack of personalization was another issue. For example, it assumed every user cared equally about every group in the account. The new dashboard addresses these problems with a flexible design that is designed to tailor to individual preferences.
Favorite groups
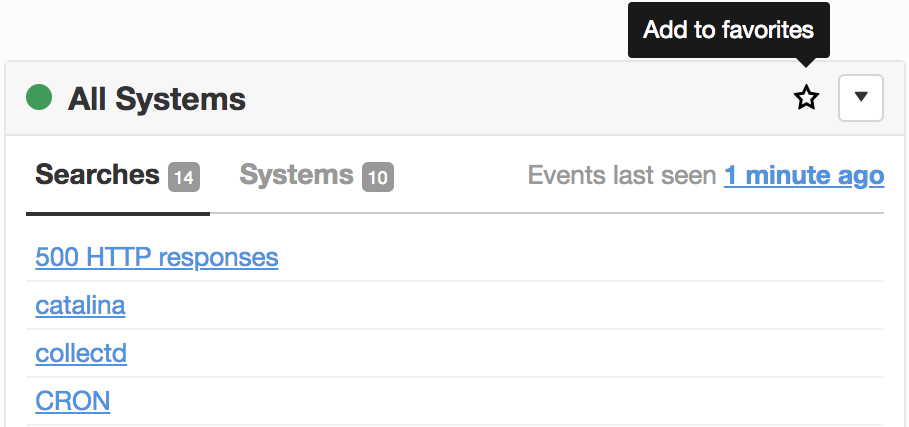
As the number of groups increases, it’s difficult to find the specific groups that interest you. With favorite groups, you can now tailor your dashboard to only show those groups.
Favorite a group by toggling the star icon next to the group name:
Traffic lights
Last year we released a feature called “traffic lights” – a visual indicator of event status for each system. Now we brought something similar to the dashboard, showing a traffic light for each group. A yellow or red light means the entire group has been inactive for one hour or one day, respectively. This can be used to ensure a group of systems are still logging after a deployment or no longer logging after being decommissioned.

Grid / List toggle
There are two ways to view groups on the dashboard – as a grid or list. The grid view shows expanded information and is enabled by default. The list view, on the other hand, shows a concise view, which can be useful when comparing group attributes for a large number of groups.

Log data transfer usage bar
Being aware of your account’s log data transfer usage is important because each plan includes a specific usage limit. When usage exceeds or gets close to the plan limit, it may be time to add event filters or change plans. Log data transfer usage has always been available in settings, but is now easier to spot at the bottom of the dashboard.

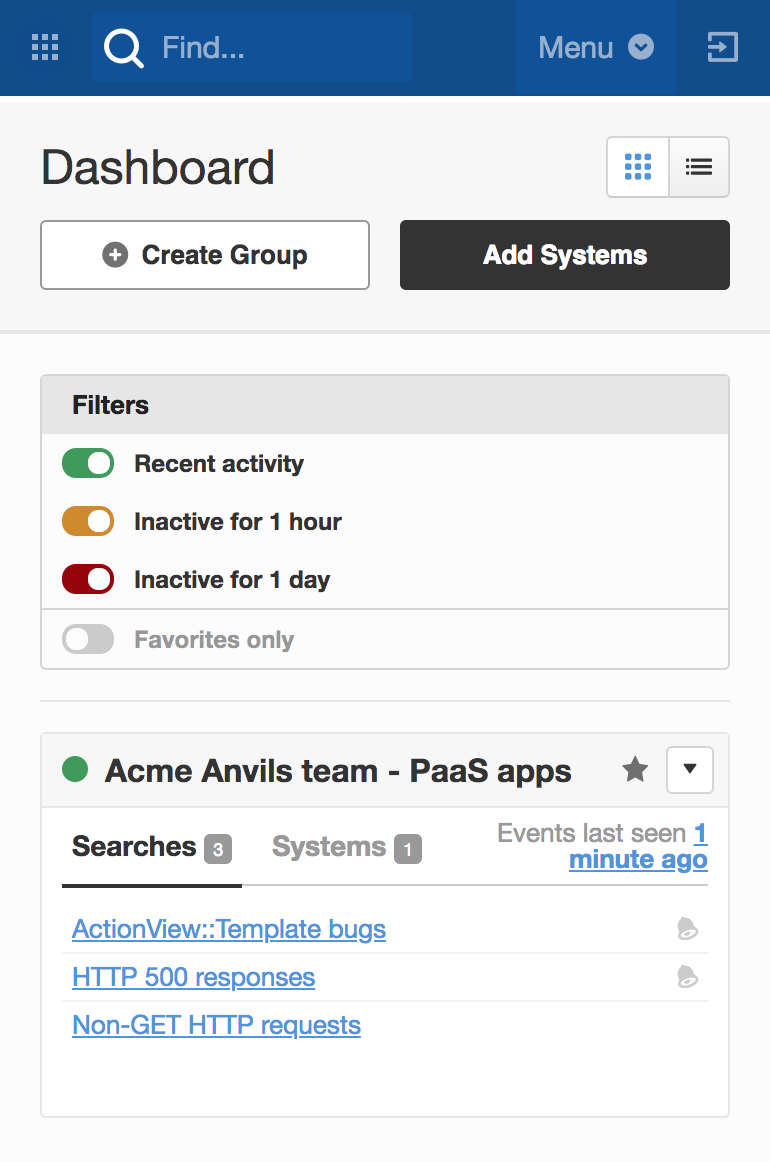
Responsive UI
The new dashboard is designed to work well on any screen size. Use the dashboard from your desktop, mobile device, or anything in between.
We hope you enjoy the new dashboard experience. If you have any feedback, please send it our way.