While Kubernetes aims to streamline containerized application management, its multi-layered architecture creates potential points of failure. Problems in any of these layers can manifest as application crashes, resource overutilization, or failed deployments, making cluster maintenance a persistent challenge.
Kubernetes meticulously logs all aspects of cluster activity and application output, from individual Pods to ReplicaSets. This comprehensive logging provides valuable insights into container, node, and overall system performance, facilitating problem diagnosis. In this post, we’ll look at some common Kubernetes problems and how to use logs to troubleshoot them.
Types of Logs
Kubernetes maintains two types of logs: application logs and cluster logs. Pods generate application logs and include application code running in a container. The Kubernetes engine and its components, such as the kubelet agent, API server, and node scheduler, generate cluster logs.
Deployment Errors
Kubernetes Deployments can fail for numerous reasons, often with immediate repercussions. The cluster log documents most deployment-related errors.
Invalid Images
Using the wrong image in a Pod declaration can prevent an entire Deployment from completing successfully. An image error can be as simple as a misspelled image name or tag or indicate a failure to download the image from a registry.
For example, let’s try to create an Nginx Pod:

While there is an Nginx image on Docker Hub, no image with the “0.10” tag exists. kubectl runs successfully, but the Pod shows a status of ImagePullBackOff:

| Name | Ready | Status | Restarts | AGE |
nginx-cbdb859bb-gn2h8 | 0/1 | ImagePullBackOff | 0 | 01m |
Kubernetes cluster logging has more information about the error:
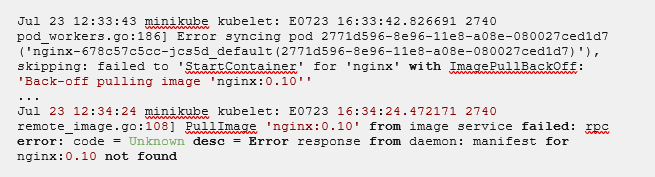
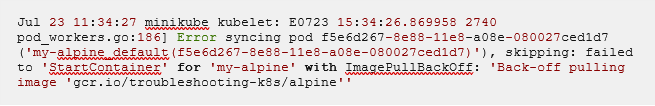
Private registries are more complicated since each node in your cluster must authenticate with the registry before pulling images. For example, upload a modified Alpine Linux image to Google Container Registry. Although our nodes can reach the registry, they aren’t authorized to pull images from it. As with Nginx, the Alpine Pod is created, but its status is ImagePullBackOff, and an error appears in the cluster log:
Lack of Resources
Kubernetes aims to schedule Pods based on CPU and RAM needs. However, when cluster-wide resource limits are reached, nodes can become unstable. This prevents new Pod deployments and leads to Pod evictions, potentially causing significant disruptions to applications, individual nodes, and the cluster as a whole.
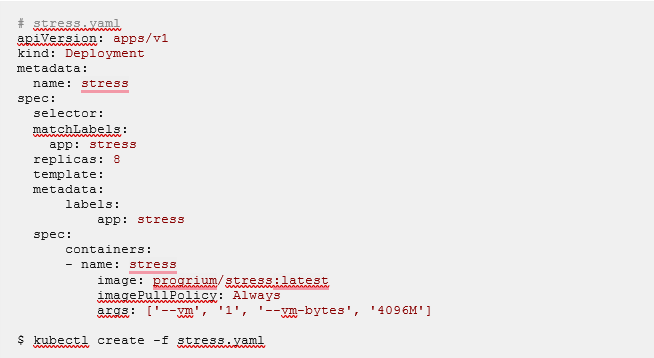
To demonstrate this, we used the docker-stress container to exhaust RAM on our node. We configured the Pod to use 4GB of RAM, then replicated it eight times:
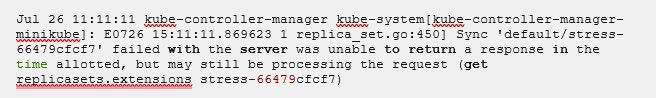
This initially caused several components to time out, including the controller itself:
As node resources become exhausted, Kubernetes will try rescheduling Pods to higher-capacity nodes. If none are available, Kubernetes will start to evict Pods, which places Pods in the Pending state. You can prevent this by setting Pod resource limits, reducing the number of ReplicaSets, or increasing the cluster’s capacity.
Operational Errors
Deployment success doesn’t guarantee flawless application performance. Post-deployment errors are common, often occurring within Pods and logged in their respective files.
Application Errors
Kubernetes automatically collects logs that containerized applications print to stdout and stderr. Each event is logged to a Pod specific file, which can be accessed using kubectl logs.
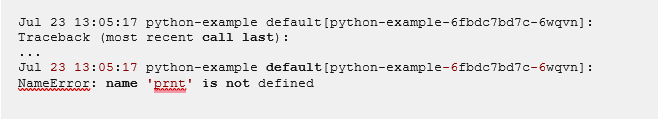
For example, let’s run a “hello world” Python script with a typo in the print function:
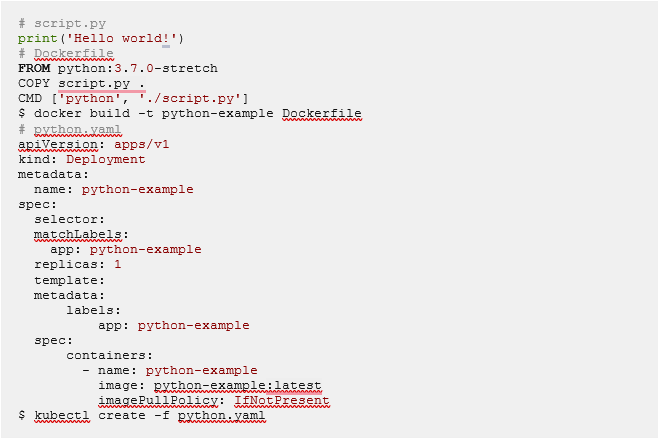
The Pod builds and runs without issues, but the application fails with an error status. Viewing the Pod’s logs shows why:
No Network Access
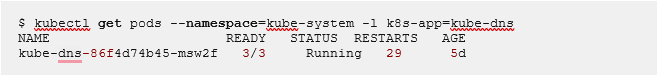
If a Pod can’t access another Pod, the DNS service might be failing. The DNS service runs as a Pod, which you can access using kubectl:
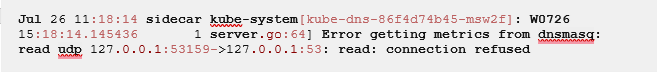
This Pod hosts three containers: kubedns monitors the Kubernetes master for changes to Services and Endpoints, dnsmasq adds caching, and sidecar performs health checks on the service. For example, if the dnsmaq container is unavailable, the sidecar container will print a message like the following:
Poor Node Health
Kubernetes has a built-in API for monitoring node events called the node problem detector. This deploys a Pod to each node that scans the node’s kernel log for new events.
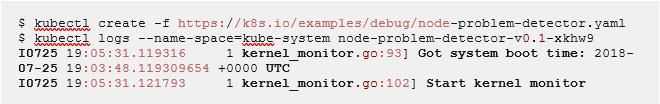
The detector currently won’t take any action in response to events. However, it’s an effective tool for detecting and reporting node changes.
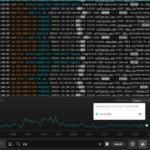
Monitoring Kubernetes Logs in SolarWinds Papertrail
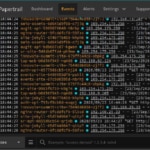
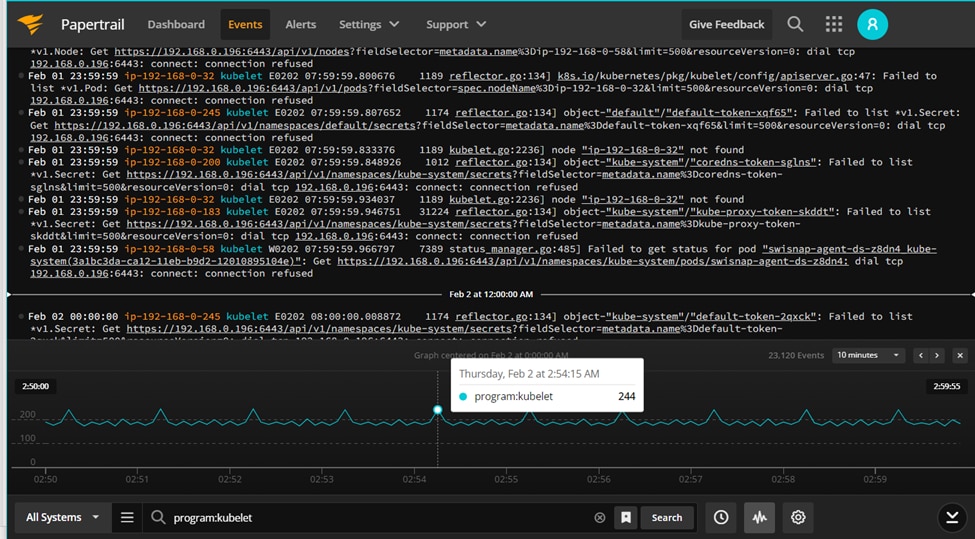
kubectl provides access to individual Pod logs but lacks centralized management. SolarWinds® Papertrail™ addresses this limitation by aggregating logs across your Kubernetes cluster into a single, searchable location. The centralized approach provided by Papertrail enables real-time event streaming, filtering by component, resource, or date range, and the ability to configure alerts for proactive monitoring.
Sending your Kubernetes logs to Papertrail is easy. The logspout DaemonSet, Pod and master component logs are automatically forwarded with no additional setup. Each event is appended with the resource name (Ex. the Pod or container name) appearing in the System field, and the component that logged it appearing in the Program field.
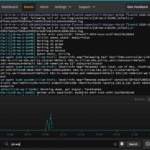
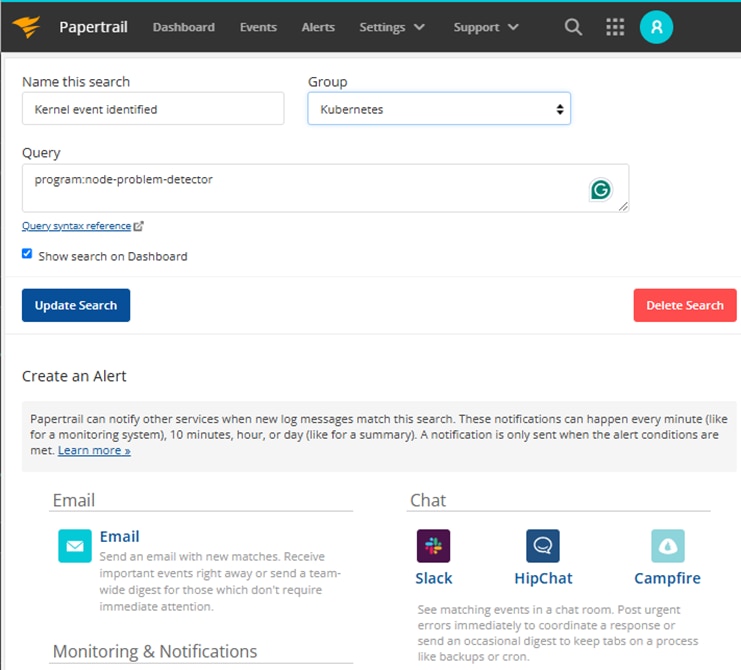
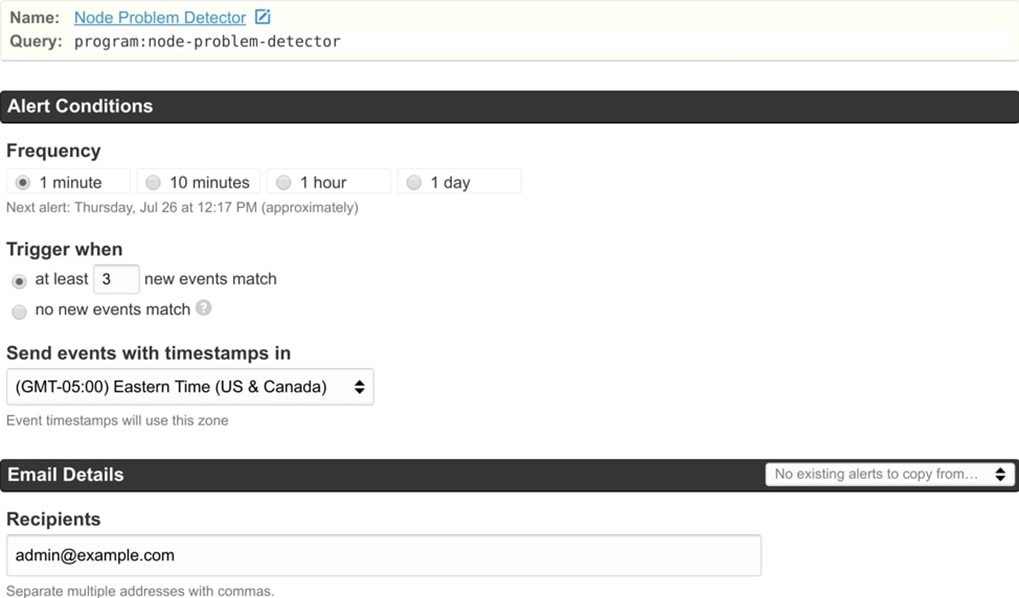
Creating Alerts
Alerts can provide instant notifications when your cluster displays unusual behavior. For example, if you want to be notified when the node problem detector reports a new kernel event. You can create a search that filters your logs to those originating from node-problem-detector, then create an alert that triggers for each new event.
Conclusion
Kubernetes logs are rich with helpful information about the state of your applications and nodes. Sending these logs to Papertrail can make it easy to monitor, filter, and search through events and troubleshoot problems faster. Sign up for a free Papertrail trial and send your Kubernetes logs to SolarWinds Papertrail today.