DevOps engineers wishing to troubleshoot Kubernetes applications can turn to log messages to pinpoint the cause of errors and their impact on the rest of the cluster. When troubleshooting a running application, engineers need real-time access to logs generated across multiple components.
Collecting live streaming log data lets engineers:
- Review container and pod activity
- Monitor the result of actions, such as creating or modifying a deployment
- Understand the interactions between containers, pods, and Kubernetes
- Monitor ingress resources and requests
- Troubleshoot errors and watch for new or recurring problems
The challenge that engineers face is accessing comprehensive, live streams of Kubernetes log data. While some solutions exist today, these are limited in their ability to live tail logs or tail multiple logs. In this article, we’ll present an all-in-one solution for live tailing your Kubernetes logs, no matter the size or complexity of your cluster.

The Limitations of Current Logging Solutions
When interacting with Kubernetes logs, engineers frequently use two solutions: the Kubernetes command line interface (CLI), or the Elastic Stack.
The Kubernetes CLI (kubectl) is an interactive tool for managing Kubernetes clusters. This tool offers a kubectl logs tail feature to view live event data. The default logging tool is the command (kubectl logs) for retrieving logs from a specific pod or container. Running this command with the --follow flag streams logs from the specified resource, allowing you to live tail its logs from your terminal.
To see how the kubectl log tail works let’s deploy a Nginx pod under the deployment name papertrail-demo. Using kubectl logs --follow [Pod name], we can view logs from the pod in real time:
$ kubectl logs --follow papertrail-demo-76bf4969df-9gs5w
10.1.1.1 - - [04/Jan/2019:22:42:11 +0000] "GET / HTTP/1.1" 200 612 "-" "Mozilla/5.0 (X11; Linux x86_64; rv:60.0) Gecko/20100101 Firefox/60.0" "-"
The main limitation of kubectl logs tail is that it only supports individual Pods. If we deployed two Nginx pod replicas instead of one, we would need to tail each pod separately. For large deployments, this could involve dozens or hundreds of separate kubectl logs instances.
The Elastic Stack (previously the ELK Stack) is a popular open-source log management solution. Although it can ingest and display log data using a web-based user interface, unfortunately, it doesn’t offer support for live tailing logs.
What is Papertrail, and How Does It Help?
SolarWinds® Papertrail™ is a cloud-hosted log management solution that lets you live tail your logs from a central location. Using Papertrail, you can view real-time log events from your entire Kubernetes cluster in a single browser window.
When a log event is sent from Kubernetes to Papertrail, Papertrail records the log’s contents along with its timestamp and origin pod. You can view these logs in a continuous stream in your browser using the Papertrail Event Viewer, as well as the Papertrail CLI client or Papertrail HTTP API. Papertrail shows all logs by default, but you can limit these to a specific pod, node, or deployment using a flexible search syntax.
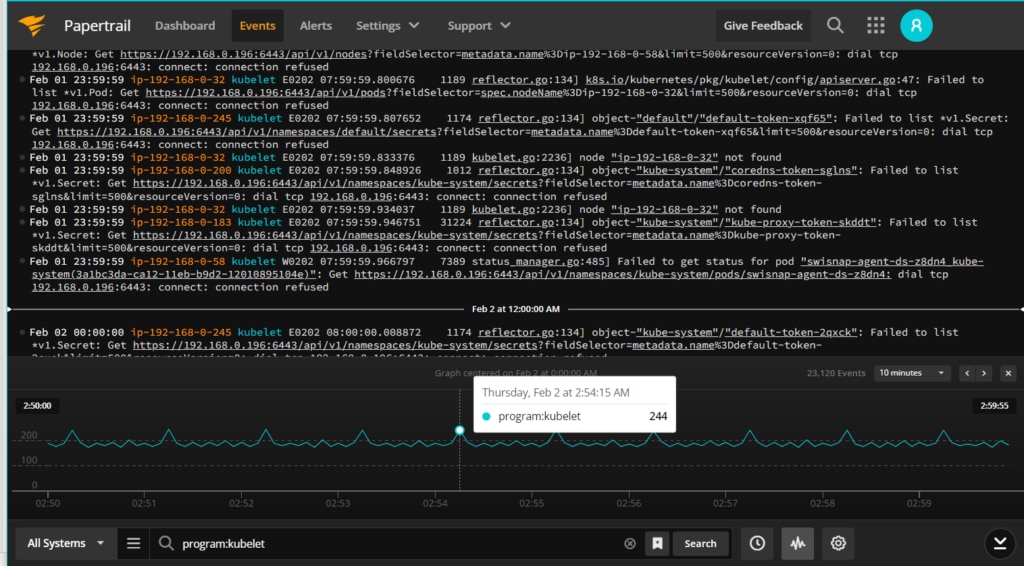
For example, let’s increase the number of replicas in our Nginx deployment to three. If we used kubectl logs -f, we would need to run it three times: one for each pod. With Papertrail, we can open the Papertrail Event Viewer and create a search that filters the stream to logs originating from the papertrail-demo deployment. Not only does this show us output from each pod in the deployment, but also Kubernetes cluster activity related to each pod:

Sending Logs from Kubernetes to Papertrail
The most effective way to send logs from Kubernetes to Papertrail is via a DaemonSet. DaemonSets run a single instance of a pod on each node in the cluster. The pod used in the DaemonSet automatically collects and forwards log events from other pods, Kubernetes, and the node itself to Papertrail.
Papertrail provides two DaemonSets:
- The Fluentd DaemonSet uses Fluentd to collect logs from containers, pods, Kubernetes, and nodes. This is the preferred method for logging a cluster.
- The Logspout DaemonSet uses logspout to monitor the Docker log stream. This option is limited to log output from containers, not Kubernetes or nodes.
We’ll demonstrate using the Fluentd DaemonSet. From a computer with kubectl installed, download fluentd-daemonset-papertrail.yaml and open it in a text editor. Change the values of FLUENT_PAPERTRAIL_HOST and FLUENT_PAPERTRAIL_PORT to match your Papertrail log destination. Optionally, you can name your instance by changing FLUENT_HOSTNAME. You can also change the Kubernetes namespace that the DaemonSet runs in by changing the namespace parameter. When you are done, deploy the DaemonSet by running:
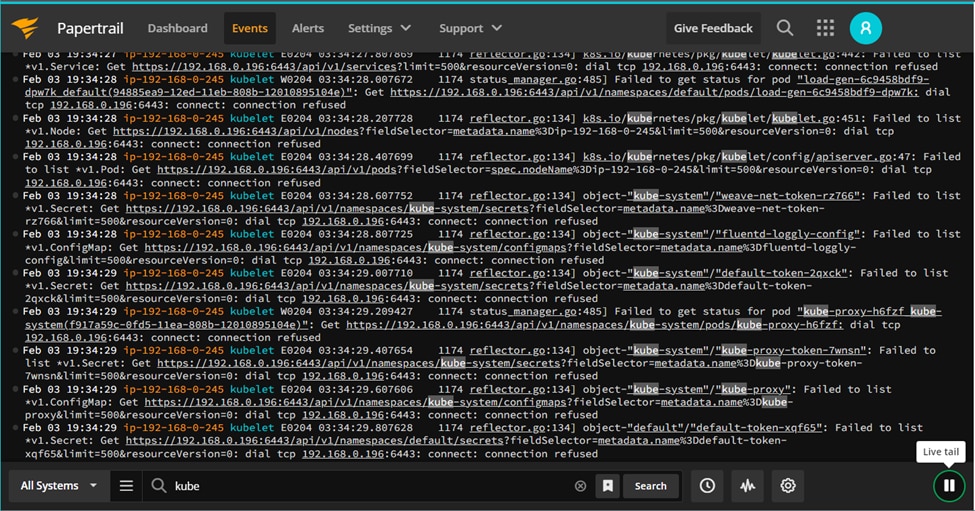
$ kubectl create -f fluentd-daemonset-papertrail.yamlIn a few moments, logs will start to appear in Papertrail:

Best Practices for Live Tailing Kubernetes Logs
To get the most out of your logs, make sure you’re following these best practices.
Log All Applications to STDOUT and STDERR
Kubernetes collects logs from Pods by monitoring their STDOUT and STDERR streams. If your application logs to another location, such as a file or remote service, Kubernetes won’t be able to detect it, and neither will your Papertrail DaemonSet. When deploying an application, make sure to route its logs to the standard output stream.
Use the Fluentd DaemonSet
The Logspout DaemonSet is limited to logging containers. The Fluentd DaemonSet, however, will log your containers, pods, and nodes. In addition to logging more resources, Fluentd also logs valuable information such as Pod names, Pod controller activity, and Pod scheduling activity.
Open Papertrail Next to Your Terminal
When you’re working on Kubernetes apps and want to debug problems with Pods, have a browser window with Papertrail open either beside or behind your terminal window. This way you can see the results of your actions after you execute them. This also saves you from having to tail manually in your terminal.
Group Logs to Make Them Easier to Find
Kubernetes pods (and containers in general) are ephemeral and often have randomly generated names. Unless you specify fixed names, it can be hard to keep track of which pods or containers to filter on. A solution is to use log groups, which let you group logs from a specific application or development team together. This helps you find the logs you need and hide everything else.
Save Searches in Papertrail
Papertrail lets you save your searches for creating custom Event Viewer sessions and alerts. You can reopen previously created live tail sessions, share your sessions with team members, or receive an instant notification when new log events arrive in the stream.
Conclusion
Kubernetes logs help DevOps teams identify deployment problems and improve the reliability of their application . Live tailing enables faster troubleshooting by helping developers collect, view, and analyze these logs in real time. To get started in SolarWinds Papertrail, sign up and start logging your Kubernetes cluster in a matter of minutes.

